
Bitcoin (BTC), the world’s leading cryptocurrency by market capitalization, continues to face significant resistance near the $110,000 level, a price zone that has emerged as a critical psychological ceiling.
The recent trading behavior suggests that BTC is now attempting to establish a new consolidation range following a meteoric rally. This price action could indicate a potential pause in the upward momentum, which is typical during prolonged bull markets.
As traders and investors digest gains, technical indicators are offering important clues for Bitcoin’s next possible move. This informative article from Fimatron outlines the main considerations and implications of the topic.
Technical Analysis: Resistance and Support Levels
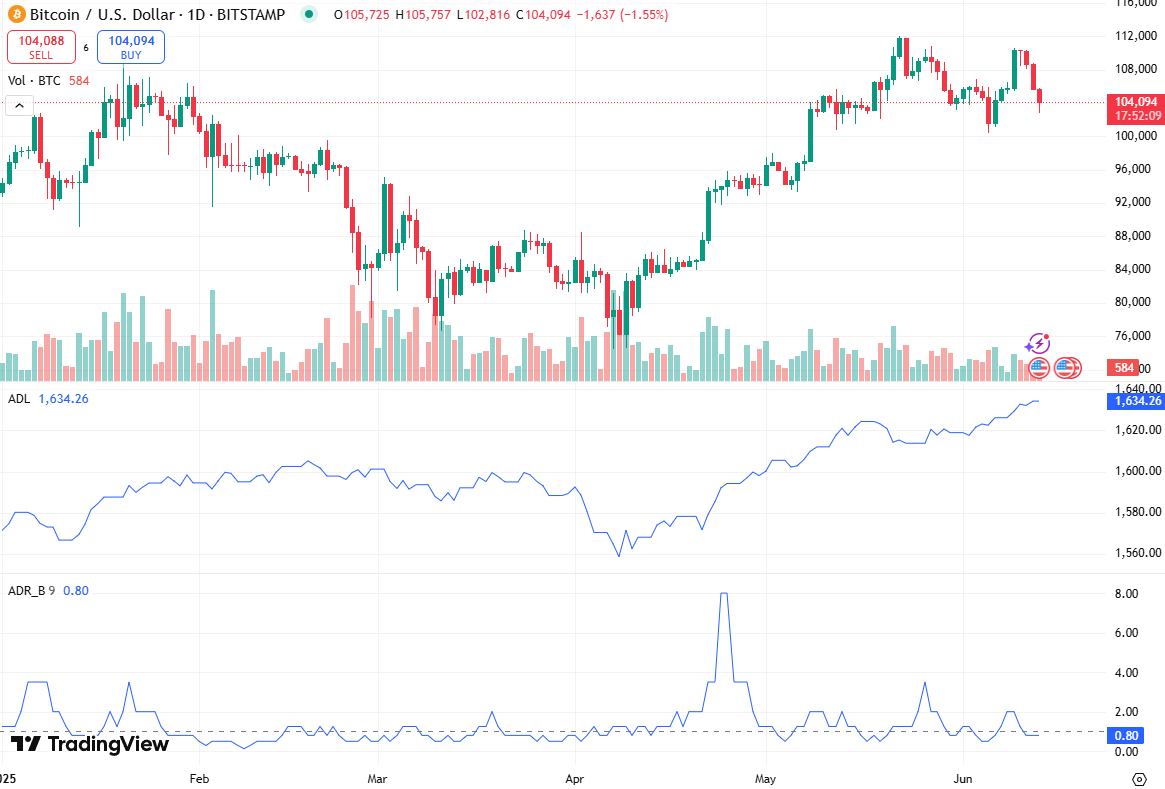
The Bitcoin technical setup currently reveals a market that is encountering headwinds near the $110,000 resistance zone. This region closely aligns with Bitcoin’s recent all-time high, making it a natural level for profit-taking and hesitation among market participants.
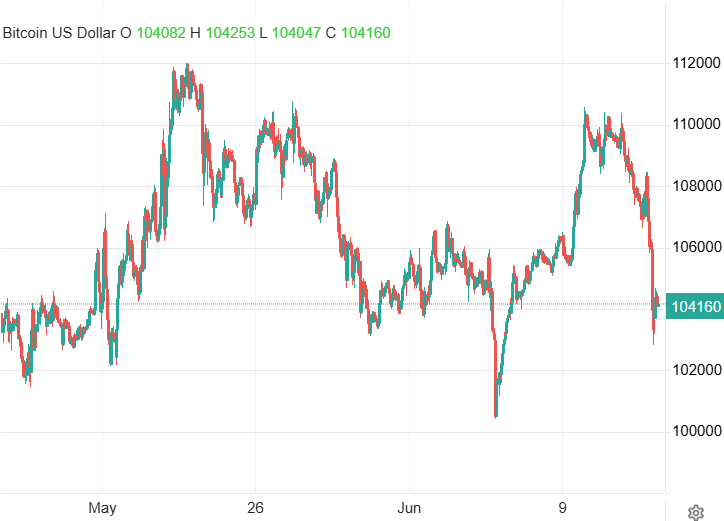
During Thursday’s session, BTC experienced a slight pullback, suggesting that the market could be losing some short-term bullish momentum.
The next logical support level appears to be around the $100,000 mark, which is not only a major round-number level but also closely aligned with the 50-day Exponential Moving Average (EMA). This convergence could act as a strong dynamic support, making the $100,000 area a key zone for accumulation.
If buyers defend this region successfully, BTC could enter a period of sideways consolidation, oscillating between $100,000 and $110,000. This would be a healthy retracement pattern in the context of a broader long-term uptrend, allowing the market to absorb previous gains and build a new base for future advances.
Implications of a Breakdown
While the $100,000 level looks sturdy for now, a decisive breakdown below this threshold would shift the short-term outlook to slightly more cautious territory. A move under this psychological and technical level could send BTC toward the 200-day EMA, which currently resides around the $90,000 region. The 200-day EMA is often viewed as the ultimate trend barometer in long-term technical analysis.
However, such a move is not the most probable scenario at the moment. Sentiment remains broadly positive, and the buy-the-dip mentality continues to dominate. Many market participants are likely to view such declines as opportunities to enter the market at more attractive price points, adding to the underlying bullish structure.
Upside Potential: Breakout Targets
If Bitcoin manages to breach the $112,000 level, it could open the floodgates for a more aggressive rally. The next major target would be the $120,000 level, which marks a clear round-number resistance and would likely bring a fresh wave of momentum-driven buying.
A breakout above $112,000 would not only clear overhead resistance but also likely trigger technical buy signals, drawing in institutional and retail interest. This could lead to higher volume inflows and a significant expansion in bullish sentiment.
In such a scenario, the parabolic structure of Bitcoin’s advance could resume, pushing prices to unprecedented levels.
Market Psychology and Accumulation Behavior
What’s currently unfolding in the Bitcoin market can also be viewed through the lens of market psychology. After a rapid move upward, it’s not unusual for prices to enter a period of rebalancing, where investors begin to accumulate positions in anticipation of the next leg higher.
This phase often features tight trading ranges, lower volatility, and volume contraction, which collectively signal that the market is building energy for a breakout.
The $100,000–$110,000 zone could therefore become a structural pivot range, defining the boundaries of the next accumulation phase. This is especially plausible considering that macro-level trends, such as increasing institutional adoption, scarcity narratives tied to halving cycles, and growing mainstream integration, continue to support Bitcoin’s long-term bullish thesis.
Conclusion: Cautious Optimism Amid Resistance
In summary, Bitcoin’s current price action shows a market at a technical crossroads. The resistance near $110,000 has proven formidable, but the underlying uptrend remains intact. A consolidation between $100,000 and $110,000 would be a constructive development, allowing the market to digest recent gains and prepare for the next leg higher.
As long as Bitcoin holds the $100,000 support level, the bulls maintain control of the broader trend. A breakout above $112,000 could be the signal that BTC is ready to challenge $120,000, but until that materializes, accumulation and patience may be the dominant market behaviors.