
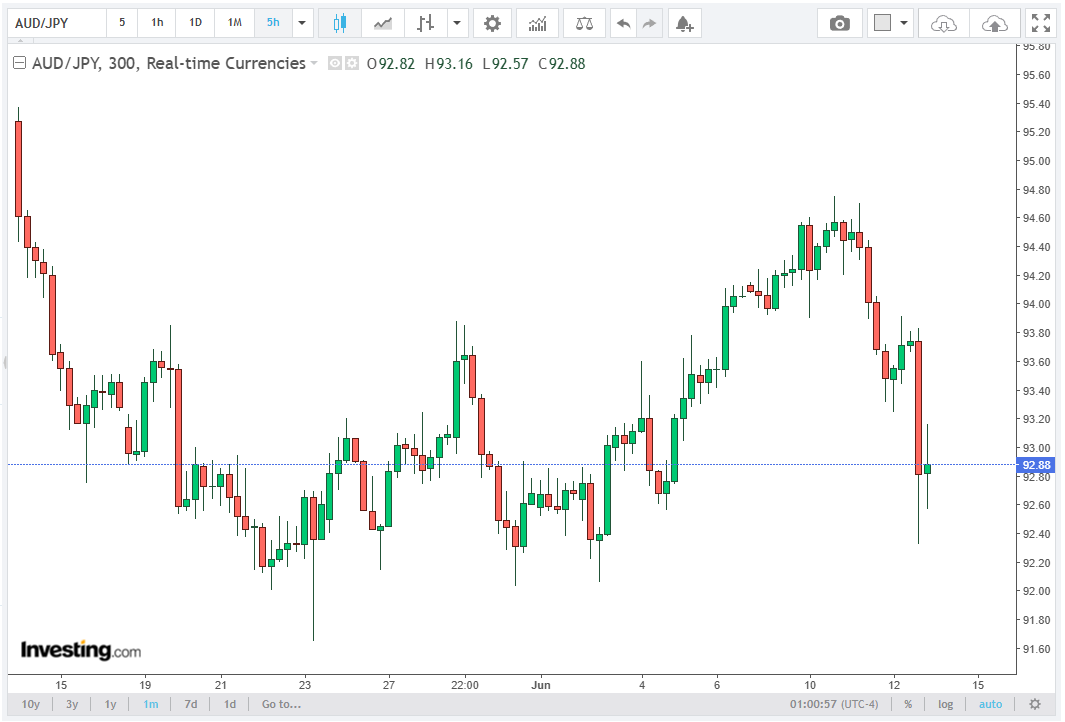
The AUD/JPY currency pair has entered a corrective phase, sliding for the second straight session and trading just beneath the 94.00 psychological level. Thursday’s action marked a 0.25% daily loss, with the pair bottoming near 93.22, before stabilizing at around 93.66 by the end of the day.
Technical signals are mixed, with some downside bias but early signs of consolidation pointing to a potential rebound. This article from Gradiopexo distills a complex issue into a clear, expert-driven narrative.
Technical Picture: Bearish Engulfing Pattern and RSI Dynamics
The most striking technical signal this week was the formation of a bearish engulfing candlestick pattern, a classic reversal signal that typically precedes further downside. This pattern emerged after the pair peaked near 94.74 earlier this week, sparking a slide that erased gains and pressed the pair lower toward 93.22.
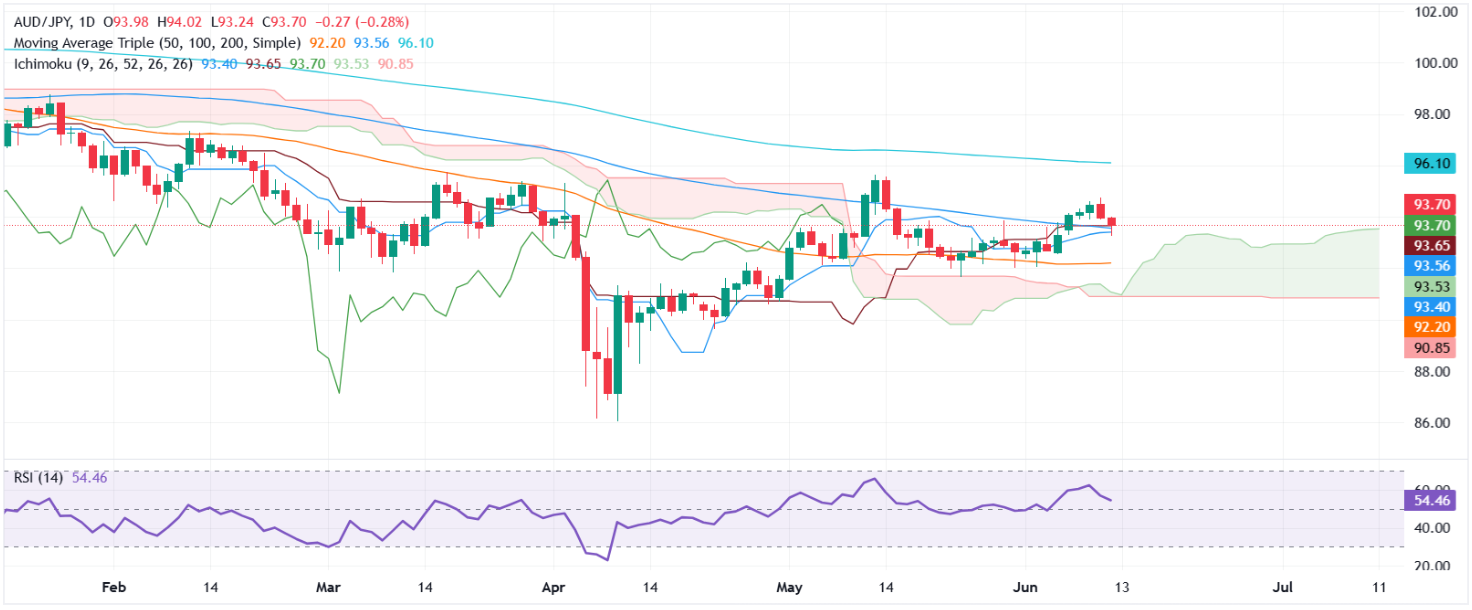
However, the Relative Strength Index (RSI), a key momentum indicator, has managed to hold above the 50-neutral threshold, currently hovering around 52. This is noteworthy because it suggests that although bearish sentiment has surfaced, momentum has not yet turned fully negative.
A sustained RSI above 50 often signals underlying bullish interest, meaning that sellers might be losing steam.
Resistance Levels: 94.00, 95.00, and Beyond
If AUD/JPY begins to retrace higher from current levels, the first key technical barrier stands at the 94.00 round figure. This level has acted as both support and resistance in recent trading sessions and represents a critical pivot point in the short term.
A decisive break above 94.00 could trigger fresh bullish momentum, exposing the pair to further gains.
The next significant resistance is located at 95.00, followed by the May 13 daily high of 95.63, which represents the local monthly top. A breakout above this zone could invite renewed interest from buyers targeting the 96.00 handle, with a longer-term bullish target at the February 12 high of 97.32.
These resistance levels are stacked relatively closely, suggesting that a breakout above 94.00 could unfold quickly toward 95.63, driven by stop orders and bullish follow-through.
Support Levels: 93.51, 93.39, and 93.00
On the downside, Senkou Span A, a key element of the Ichimoku Cloud, is currently offering immediate support at 93.51. This dynamic level is widely watched by technical traders, as breaks below the cloud often signal the potential for trend reversals.
Further below lies the Tenkan-sen, another Ichimoku component, at 93.39. A breach of both these levels could accelerate the decline toward the critical 93.00 psychological floor. This level has not only been tested multiple times in recent months but also acts as a major sentiment anchor.
Should this 93.00 threshold give way, the bearish case would strengthen, potentially opening the door toward deeper retracements near 92.50 and even the 200-day Simple Moving Average (SMA) below 92.00.
Market Outlook: Cautious Consolidation with Bullish Potential
In the near term, the AUD/JPY outlook appears cautiously neutral-to-bullish. While the bearish engulfing pattern points to possible downside continuation, the failure to pierce through key support levels such as 93.51 and 93.39, combined with an RSI above 50, suggests that selling pressure is losing momentum.
If prices consolidate above 93.50 and reclaim 94.00, the bullish thesis would gain traction, especially if risk sentiment improves or the JPY resumes its broader weakening trend. In such a case, bulls may target a move back toward 95.00 and eventually 95.63.
However, if sellers regain control and drive the pair below 93.39, especially on strong JPY inflows, the next battle will be fought at 93.00, a break of which could swing the bias firmly in favor of the bears.
Conclusion
The AUD/JPY is at a pivotal juncture following its recent two-day decline. The market is currently in a technical stalemate: bearish signals such as the engulfing candle are counterbalanced by resilient RSI readings and firm support from Ichimoku levels.
With the cross-pair trading just above 93.65, traders should closely monitor the 94.00 resistance and 93.00 support zones. These levels will likely dictate short-term price direction in response to evolving market sentiment, central bank guidance, and macro headlines.