
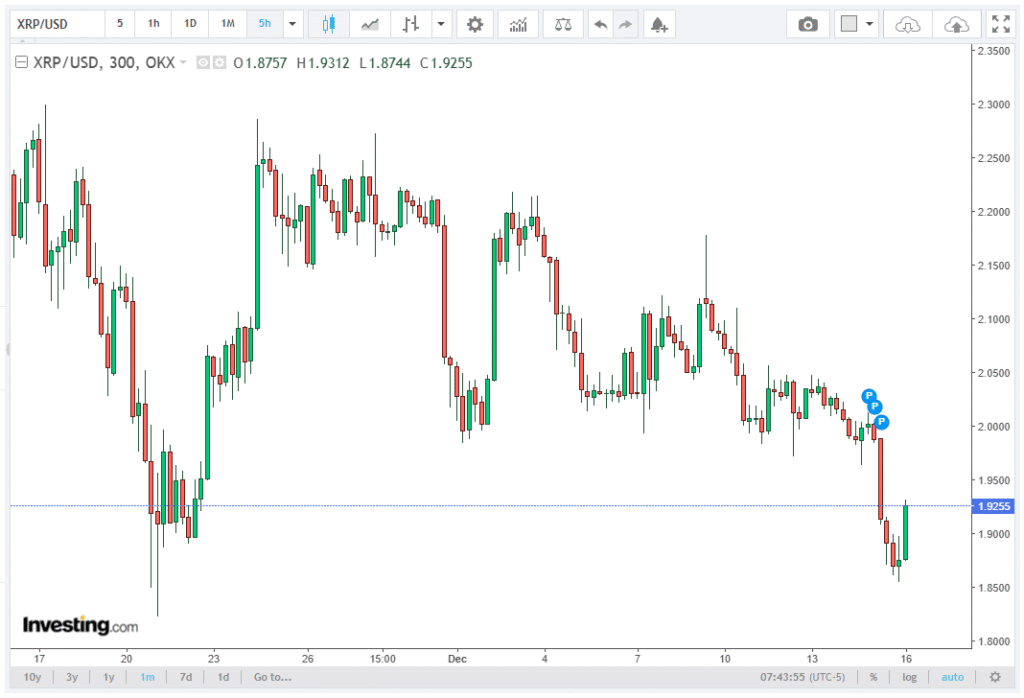
XRP/USD has been trading in a consolidation range between $1.90 and $1.99, with intraday swings from $1.91 to $2.01. Market capitalization hovers near $116–$120 billion, while 24-hour trading volume fluctuates between $1.7–$2.7 billion.
The chart reflects a clear equilibrium zone rather than a directional trend: sellers defend the $2.00 level, while buyers step in repeatedly between $1.96 and $1.90. The Orbisolyx team provides a complete and thoughtfully organized breakdown of the issue.
Market Infrastructure Outpacing Price
Beneath the surface, regulated infrastructure for XRP has advanced rapidly. CME recently introduced spot-quoted XRP futures, positioning XRP alongside BTC and ETH in a futures format that is margined in spot terms and features longer expiries. This setup enables macro desks and institutional traders to hedge or leverage XRP exposure efficiently, providing a cleaner alternative to offshore perpetual contracts.
Simultaneously, U.S. spot XRP ETFs have amassed roughly $0.9–$1.0 billion in cumulative inflows, now holding $1.1–$1.2 billion in assets. Daily inflows of $20–50 million persist even below $2.00, marking multiple weeks of continuous net buying. This is structural accumulation: regulated vehicles steadily acquire XRP exposure, while the public chart remains unattractive for most retail traders.
Medium-Term Bull Case Rooted in Infrastructure
The bull case for XRP/USD extends beyond price targets. Major market infrastructure players are moving workflows on-chain, experimenting with tokenized rails for securities, sovereign wealth, and real-world assets. Discussions often reference $3–$4 quadrillion in legacy system notional, potentially moving toward tokenization.
This integration links stablecoin liquidity, payments, and DeFi-style swaps, keeping XRP holders involved. Even a fraction of the “tens or hundreds of trillions” in tokenized assets flowing through XRP rails could render the current $116–$120B market cap a substantial undervaluation.
Short-Term Technical Observations
From a technical standpoint, XRP/USD is controlled rather than broken. A TD Sequential buy signal appeared near $1.90, typically marking exhaustion after selling pressure. On-chain, spent-coin metrics show XRP moving to sell has collapsed 95%, dropping from 132 million XRP to 4.6 million, the lowest level in over a month.
Macro analysts suggest that large funds are quietly accumulating XRP through OTC channels and ETF structures, intentionally avoiding public disclosure. Another view describes this as “controlled price” action: institutional and ETF demand soaks up the available float, order books stay dense at resistance levels, and the price chart appears subdued, keeping retail traders on the sidelines. The outcome is an accumulation zone cleverly disguised as stagnation.
Key Technical Levels
Structurally, XRP/USD exhibits well-defined boundaries. On the upside, resistance at $2.00–$2.01 has been repeatedly rejected on high volume, while a clean break above $2.11 would signal buyers regaining control. Further resistance lies at $2.21–$2.28, aligned with the 50-day EMA, acting as the next breakout gate, with $2.35–$2.60 representing momentum territory, filling prior deleverage inefficiencies.
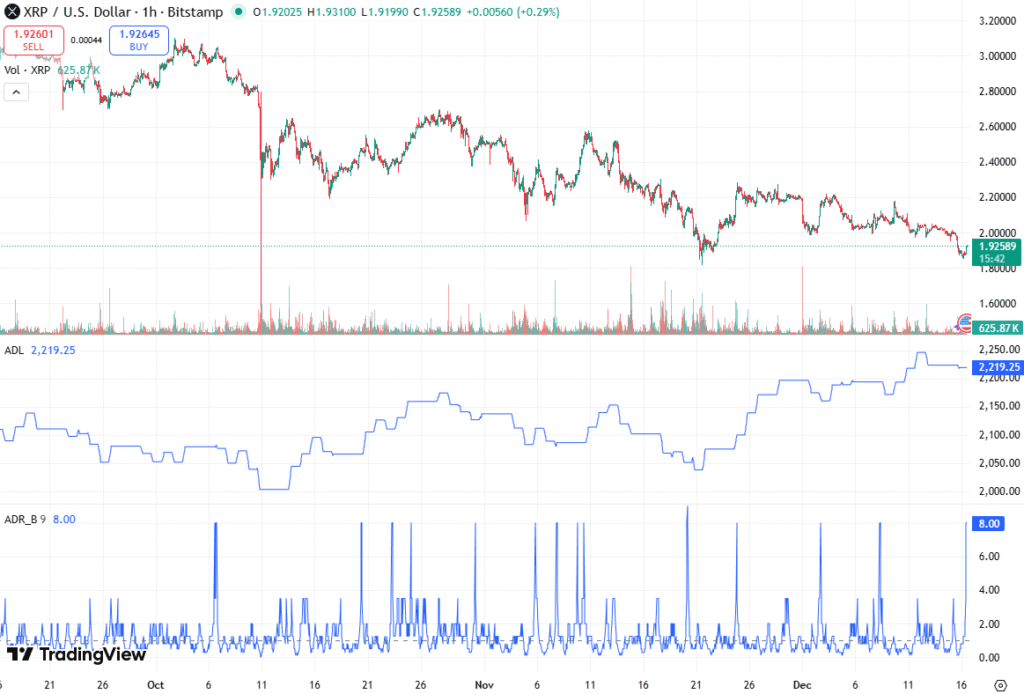
On the downside, support at $1.97–$1.96 provides immediate demand, while the $1.90 line is critical; a daily close below shifts sentiment from consolidation to bearish, with further support at $1.82–$1.81 and $1.52. Momentum indicators confirm a coiled setup: the 4-hour RSI sits near 40–45, showing a mild bearish bias but waning strength, and MACD convergence signals compression rather than collapse.
Structural Levers Driving Near-Term Direction
Three key levers dominate XRP/USD near-term dynamics. ETF flows show spot XRP ETFs holding $1.1–$1.2B, with potential first-year demand of $5–$8B, which could translate to $8–$10 per XRP from a market-cap perspective. CME spot-quoted futures provide institutional tools for directional trading in regulated markets, supporting breakouts above $2.00, $2.28, or $2.60 with institutional volume.
Finally, the January 1, 2026, escrow unlock could release up to 1 billion XRP, influencing year-end risk; if price remains below $2.00, preemptive shorting may occur, though ETF inflows and demand at $1.96–$1.90 help the market absorb the unlock.
Conclusion: Accumulation Under the Radar
XRP/USD currently trades in an accumulation-style range, with infrastructure advances outpacing price action. ETF adoption, CME futures, tokenization exposure, and RLUSD multichain integration support a medium-term bullish bias.
Key levels define risk and opportunity: $1.96–$1.90 sustains potential upside to $2.35–$2.60 (+25–35%), while a daily close below $1.90 shifts attention to $1.82 or $1.52 (5–20% downside). With nearly $1B in spot ETFs and new derivatives plumbing, evidence tilts bullish but remains unconfirmed. A decisive breakout above $2.00–$2.28 will trigger momentum, while the critical invalidation line is simple: a daily close under $1.90.