
The GBP/JPY currency pair surged to a fresh all-time high of 209.18 during the early European trading session on Friday, continuing its bullish momentum from recent sessions. This marks a notable advance following minor losses observed in the previous session, signaling strong buying interest in the cross. The Aurudium team provides a comprehensive and well-organized overview of the matter.
The daily chart reveals that GBP/JPY is moving steadily within an ascending channel pattern, underscoring a persistent bullish bias. Traders are closely monitoring the pair as it tests key resistance levels above 209.00, indicating a strong upward trend supported by robust technical indicators.
Technical Indicators Confirm Uptrend
A key element supporting the bullish trend is the relationship between moving averages. The nine-day Exponential Moving Average (EMA) has recently crossed above the 50-day EMA, a classic bullish signal that reinforces upward momentum. The GBP/JPY cross continues to hold above both the nine-day EMA and the 50-day EMA, confirming trend strength and providing traders with confidence in a continued upward trajectory.
Momentum indicators further support the bullish bias. The 14-day Relative Strength Index (RSI), currently at 66.90, remains in bullish territory while staying below overbought levels. The RSI has strengthened over recent sessions, suggesting that the uptrend is sustainable and that further gains are likely before any potential corrective pullback.
Resistance Levels and Potential Upside
GBP/JPY could potentially target fresh highs near 210.00, a psychological level that often draws market attention and can influence trader behavior. Should the pair break above 210.00, the next significant resistance lies near the upper boundary of the ascending channel at 213.10, which may act as a longer-term target for traders following the bullish trend.
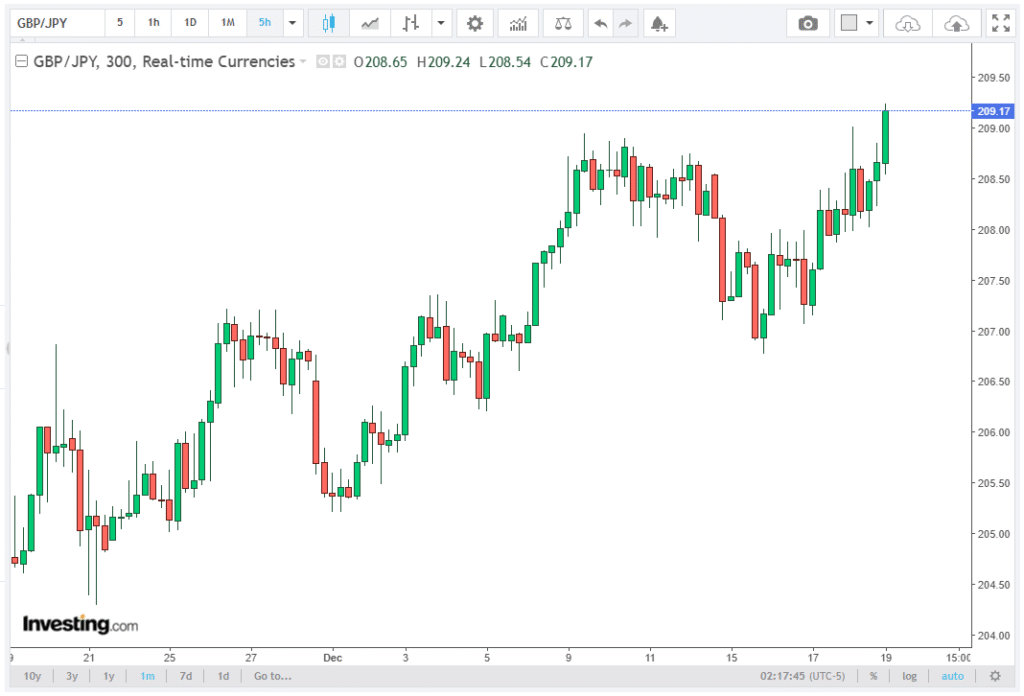
Short-term momentum remains firm as ascending EMAs help contain any minor pullbacks, ensuring the upward bias is preserved. Traders should watch for sustained buying pressure above 209.00 as a sign of trend continuation, while intraday support levels can provide entry points for long positions.
Key Support Levels
On the downside, primary support for GBP/JPY is located at the nine-day EMA around 208.10, offering a near-term safety net for bullish traders. Should the pair dip below this level, the lower boundary of the ascending channel near 207.50 acts as a secondary support area, potentially preventing further declines.
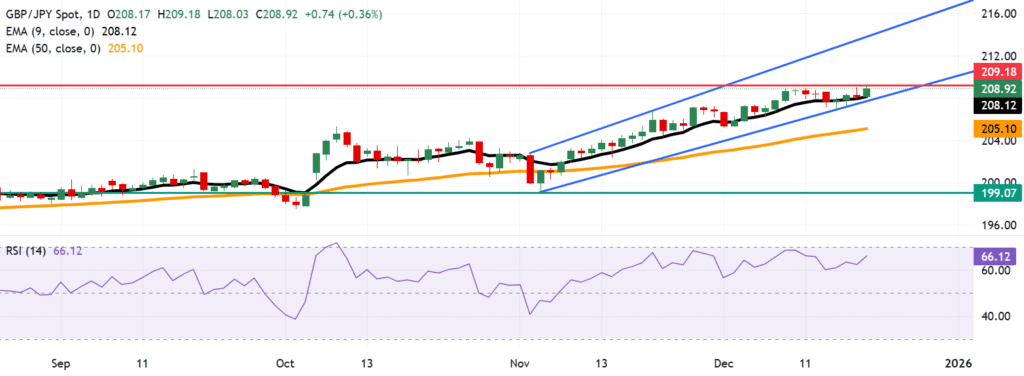
A break below these critical support levels would weaken the bullish bias, signaling a possible shift in market sentiment. In such a scenario, the 50-day EMA at 205.10 becomes a significant support point that may determine whether the pair can regain upward momentum or face deeper corrective pressure.
Market Sentiment and Outlook
The overall market sentiment for GBP/JPY remains strongly bullish, driven by a combination of technical momentum and positive trend indicators. The ascending channel, rising short- and medium-term EMAs, and RSI levels below overbought conditions all point to the potential for further gains in the coming sessions.
Traders should remain attentive to resistance at 210.00 and the upper channel boundary at 213.10, as breakouts above these levels could accelerate upward movement. Conversely, pullbacks to the nine-day EMA or the lower channel boundary may provide strategic buying opportunities without undermining the bullish framework.
GBP/JPY Forecast: Bullish Momentum Likely to Continue
Looking ahead, the GBP/JPY forecast remains bullish as market momentum shows little sign of slowing. With the pair trading above the nine-day and 50-day EMAs, and the RSI comfortably below overbought levels, technical conditions support further upside potential.
Traders may expect GBP/JPY to test 210.00 and possibly approach the upper channel boundary at 213.10, provided buying pressure persists. Short-term retracements to the 208.10 EMA could offer strategic entry points without undermining the overall bullish outlook.
Trading Strategy Considerations
For traders monitoring GBP/JPY, the current setup suggests a trend-following approach may be advantageous. Long positions can be considered on retracements toward the nine-day EMA at 208.10 with targets set at 210.00 and 213.10, in line with the ascending channel pattern.
Stop-loss placement should be considered just below key support levels, such as the lower channel boundary at 207.50 or the 50-day EMA at 205.10, to manage downside risk effectively. Monitoring RSI levels is also crucial, as approaching overbought territory could signal short-term exhaustion before further continuation.
Conclusion
In summary, GBP/JPY continues to exhibit a strong bullish bias, reaching a new all-time high of 209.18. Technical indicators, including the ascending EMAs, daily channel trend, and the RSI at 66.90, support the likelihood of further upward movement.
Key resistance levels at 210.00 and 213.10 will be closely watched, while support levels at the nine-day EMA and the lower channel boundary provide near-term safety nets.