
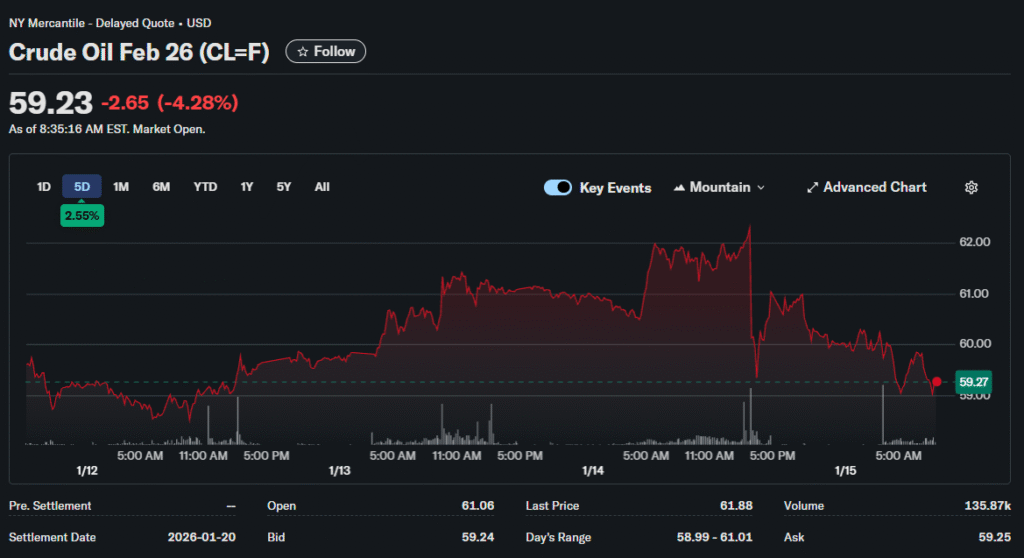
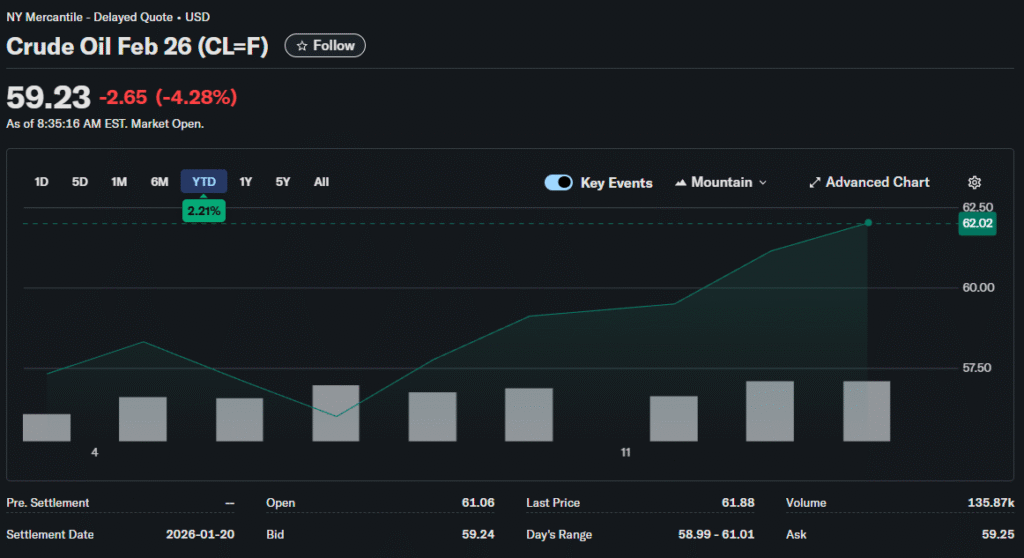
Middle East tensions drive energy markets to three-month highs. WTI crude surged near $62 per barrel while Brent crude reached approximately $66, marking the strongest price levels since early October. Lead financial expert at Altiryus examines whether supply disruptions materialize or remain hypothetical.
Iran Protests Create Uncertainty
Political unrest in Iran escalated significantly, with the White House canceling diplomatic meetings until demonstrations ceased. The U.S. President signaled support for protesters while national security officials reportedly prepared contingency options.
Iran produces roughly 3.3 million barrels per day of crude oil. Any meaningful disruption to this output would substantially tighten global supply, particularly given OPEC+ production constraints.
The risk extends beyond Iranian production itself. The Strait of Hormuz carries approximately 20% of global oil supply, and escalating tensions raise the specter of shipping disruptions.
Kazakhstan Adds Supply Pressures
Disruptions at the Caspian Pipeline Consortium terminal compounded supply worries. A combination of severe winter weather, scheduled maintenance, and reported drone strikes reduced loading capacity by nearly half.
Kazakhstan’s loading fell to approximately 900,000 barrels per day, removing meaningful volumes from global markets. The winter weather complications suggest these constraints may persist for several more weeks.
Pipeline infrastructure remains vulnerable to various disruption scenarios. Markets price this reality into risk premiums, particularly when geopolitical tensions run elevated.
Venezuela Complicates the Picture
Venezuela’s extra-heavy crude from the Orinoco Belt carries breakeven costs above $80 per barrel. At current prices around $60-65, this production remains economically challenged.
The Venezuelan supply agreement represents a political solution to address domestic refining needs. Questions remain about sustainable production levels and quality specifications.
Refining Margins Show Pressure
Refiners face a challenging environment as crack spreads narrow across major products. Gasoline margins compressed significantly from 2024 peaks, reducing profitability for processing operations.
Diesel crack spreads held up better than gasoline, but still traded below levels that incentivize maximum production. Refiners adjust run rates in response, potentially tightening product supplies later.
European refineries particularly struggled as natural gas costs remain elevated relative to historical norms. This cost disadvantage forces some facilities to reduce utilization rates.
Asian refining capacity continues to expand despite margin pressures. New facilities in China and India add processing capability, intensifying competition for crude feedstock.
Inventory Data Provides Mixed Signals
U.S. crude inventories rose by 5.3 million barrels according to industry data, potentially representing the biggest build in two months. Rising stockpiles typically pressure prices by indicating weak demand or oversupply.
Gasoline inventories also increased while distillate stockpiles fell, creating a mixed demand picture. Diesel weakness often signals slowdowns in industrial activity.
The inventory increase occurred despite refinery run rates remaining relatively high. This suggests import flows exceeded domestic consumption, possibly due to seasonal factors.
OPEC+ Production Strategy Under Scrutiny
The cartel faces difficult decisions about production levels as members balance revenue needs against market stability. Some countries want higher output quotas while others prefer maintaining current restrictions.
Compliance with agreed production cuts varies significantly across member nations. Several countries consistently produce above their allocated quotas, undermining the collective strategy.
Saudi Arabia holds substantial spare production capacity but shows reluctance to flood markets. The kingdom’s preference for stable prices around current levels reflects fiscal policy requirements.
Non-OPEC producers continue increasing output, particularly in the Americas. U.S. shale production demonstrates remarkable resilience despite lower prices, while Canadian output reaches record levels.
Speculator Positioning Creates Volatility
Hedge funds and commodity trading advisors significantly increased long positions in crude futures over the past two weeks. This concentrated positioning amplifies price movements in both directions.
Net long positions by managed money reached multi-month highs just as geopolitical tensions escalated. These speculative bets add momentum to rallies but create downside risk if sentiment shifts.
Options markets indicate elevated demand for upside calls, suggesting that traders are positioning for further gains. Implied volatility jumped sharply, making options strategies more expensive.
Algorithmic trading systems respond rapidly to geopolitical headlines, resulting in sharp intraday price fluctuations. This technical activity can temporarily disconnect prices from fundamental supply-and-demand dynamics.
Technical Dynamics Support Bulls
WTI broke above a long-term descending trendline, signaling that a potential reversal from the previous downtrend could be underway. The price currently trades around $61.52 per barrel, having surged past this key resistance zone.
Fibonacci retracement analysis shows potential support levels if prices pull back. The 38.2% retracement is located at $59.25, near the broken trendline that has shifted from resistance to support.
Technical momentum indicators show room for additional gains before overbought conditions emerge. However, prices gained approximately 11% over the past week, suggesting that some consolidation may be a healthy development.
The Path Forward
Energy markets face competing forces. Geopolitical risk premiums support prices, while concerns about demand and rising inventories create downward pressure.
The subsequent several trading sessions will determine whether current levels represent a new range or a temporary spike. Watch inventory reports, geopolitical developments, and demand indicators for directional clues that could shape February trading patterns.