
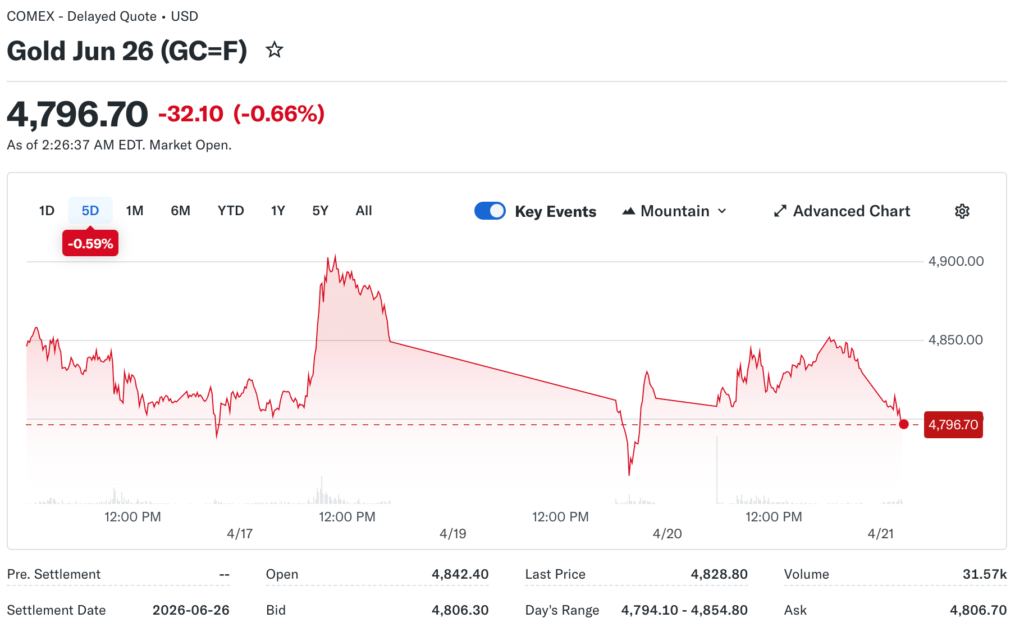
Gold prices fluctuated around $4,800 per ounce on Tuesday as investors weighed inflation concerns against rising real interest rates, pressuring valuations. The precious metal declined modestly from earlier highs as renewed geopolitical tensions paradoxically strengthened the dollar more than safe-haven gold demand. Silver and platinum showed more volatility than gold, reflecting their greater industrial demand components and smaller market sizes, amplifying price swings.
Analysts from Nummvix examine how precious metals markets reflected complex dynamics between inflation hedge characteristics and opportunity cost from higher yields elsewhere. Central bank buying remained robust, particularly from emerging market institutions seeking to diversify reserves away from dollar-denominated assets gradually. The jewelry demand from key markets like India and China showed resilience despite elevated prices as cultural significance and wealth preservation motives sustained purchases.
The Inflation Narrative
Consumer prices accelerated from the energy shock, renewing focus on gold’s traditional role as inflation protection across investment portfolios. The precious metal historically preserved purchasing power during periods of currency debasement, though the relationship proved imperfect in the short term. Real yields are turning more positive as nominal Treasury rates rose faster than inflation expectations, creating headwind for non-yielding assets like bullion.
Break-even inflation rates derived from Treasury Inflation-Protected Securities suggested the market expects sustained elevated price pressures above the Federal Reserve target. The inflation expectations divergence between market measures and consumer surveys created uncertainty about the actual trajectory. Wage growth persistence indicated potential for embedded inflation requiring a longer period of restrictive monetary policy to bring under control.
The Interest Rate Headwind
Treasury yields climbing above 4.25% for 10-year maturity created opportunity cost for holding zero-yielding gold that pressured valuations. The real interest rates turning positive as inflation moderated faster than nominal rates declined made yield-generating alternatives more attractive. The Federal Reserve’s maintaining a restrictive policy stance longer than many anticipated kept pressure on precious metals prices.
Rate expectations shifted multiple times as economic data and geopolitical developments altered market views on the monetary policy trajectory. The futures markets’ pricing delayed Fed cuts pushed further into late 2026 or early 2027, reducing near-term support for gold. Term premium returning to Treasury yields as investors demanded compensation for duration risk rather than accepting negative real returns.
The Dollar Correlation
Currency strength is typically inverse to gold prices as dollar appreciation makes dollar-denominated commodities more expensive for foreign buyers. The Dollar Index gains created mathematical headwind for gold even as underlying drivers might support prices. Purchasing power differentials across currencies created arbitrage opportunities that aligned global gold prices.
Cross-currency dynamics complicated simple correlations as gold showed varying performance against different currencies simultaneously. The euro-denominated gold actually gained despite dollar price weakness, reflecting single currency depreciation. Emerging market currencies generally weaken against the dollar, making gold more expensive in local terms, potentially reducing demand from those regions.
Reserve diversification by central banks continued with gold purchases offsetting dollar sales to balance portfolios toward neutral weighting. The strategic buying less sensitive to short-term price movements as institutions focus on long-term asset allocation objectives. Geopolitical considerations have increased the importance of physical gold holdings rather than claims on metal held elsewhere.
The Supply Dynamics
Mine production remained relatively flat as new project development timelines extended and existing operations matured, reducing output. The capital intensity of gold mining limited the supply response to higher prices, unlike some other commodities. All-in sustaining costs for producers average around $1,300 per ounce, providing a substantial margin cushion at current price levels.
Recycling activity increased somewhat as elevated prices encouraged holders to monetize jewelry and other gold items. The scrap supply remained well below peak levels from 2013, when prices previously reached similar nominal levels. Secondary market liquidity is strong, with bid-ask spreads remaining narrow, indicating healthy market function.
The Industrial Demand
Electronics manufacturing utilized gold in semiconductors and connectors, though quantities per device declined as miniaturization continued. The technology applications remained relatively price-inelastic as gold content represented a small fraction of total device costs. Medical and dental uses sustained steady demand, though substitution by other materials is ongoing where feasible.
Aerospace and defense applications valued gold’s properties for specific uses in extreme environments and critical systems. Space exploration increased usage as satellite deployments accelerated for communications and observation purposes. Catalyst applications in chemical processing represented a niche but stable demand source.
The Investment Outlook
Portfolio allocation recommendations for gold typically ranged from 5-10% of total assets as a diversification and tail-risk hedge. The actual allocations in most portfolios below the recommended ranges, creating potential for catch-up buying. Correlation with other assets, particularly equities historically been low, making gold an effective diversifier.
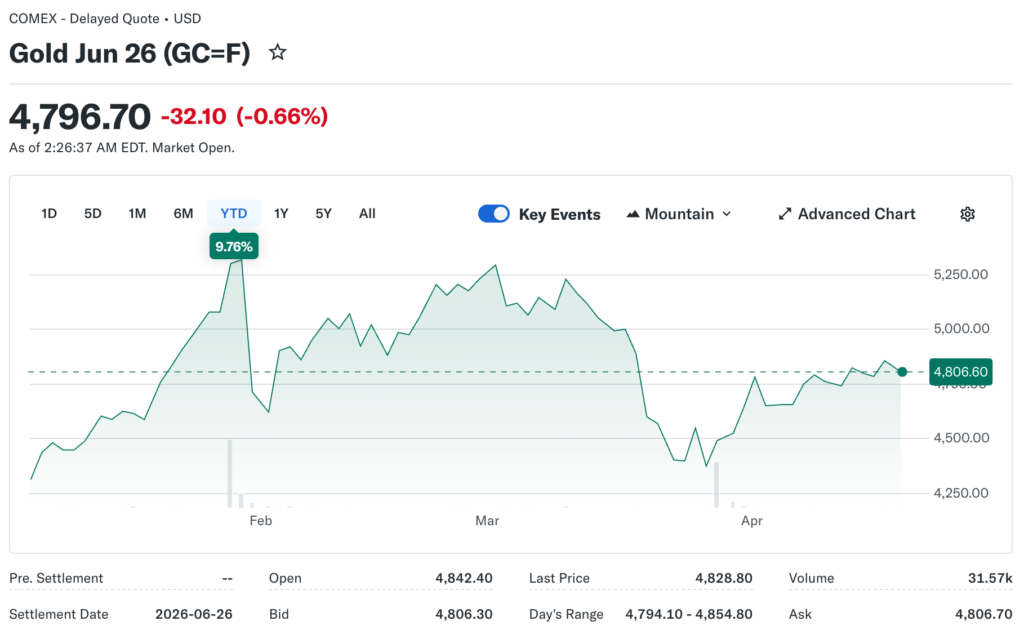
Valuation frameworks for gold challenging, given the lack of cash flows, though inflation-adjusted prices and gold-to-GDP ratios provided benchmarks. Current prices near inflation-adjusted highs, though below the 2011 peak in real terms. Technical levels from chart analysis suggested support around $4,600 with resistance at $5,000, though fundamentals ultimately would determine the trajectory.