
The BTC/USD pair has entered a renewed bullish phase this week, with Bitcoin price accelerating above a critical resistance level of $78,000 and reaching $79,000, its highest level since January. This move confirms a strengthening bull run, driven by a combination of institutional inflows, whale accumulation, and improving technical indicators. This topic is explained in a clear and in-depth way by the team at Fondesia in their article.
From its yearly low of $60,000 in February, Bitcoin has now surged by more than 31%, signaling a decisive shift in market sentiment from consolidation to expansion. The breakout above key resistance zones suggests that buyers are regaining control of the medium-term trend.
ETF Inflows Drive Institutional Demand
One of the most significant catalysts behind the current rally is the surge in spot Bitcoin ETF inflows. These inflows are not only sustaining upward momentum but also signaling a broader structural shift in demand.
Recent data shows that spot Bitcoin ETFs are approaching $2 billion in inflows this month alone, highlighting persistent institutional appetite. Leading the charge is BlackRock’s IBIT, which has played a central role in accelerating adoption.
Collectively, Bitcoin ETFs have now accumulated more than $58 billion in net asset additions, pushing total ETF-managed Bitcoin assets to approximately $100 billion. This rapid expansion underscores how Bitcoin is increasingly being integrated into traditional investment portfolios.
The consistent inflows suggest that institutional investors are treating Bitcoin less as a speculative asset and more as a strategic macro allocation.
Whale Accumulation and Corporate Buying Pressure
Beyond ETFs, whale activity has also played a crucial role in sustaining the current rally. On-chain data shows that large holders have accumulated millions of dollars worth of Bitcoin over the past few months, reducing circulating supply and tightening market liquidity.
Corporate accumulation has further reinforced this trend. One of the most prominent buyers, Strategy, now holds Bitcoin worth over $64 billion, with an average acquisition cost of approximately $75,528 per BTC. Despite market volatility, the firm is currently sitting on a 4.3% unrealized profit, reflecting strong long-term positioning.
Similarly, American Bitcoin has expanded its holdings to approximately 7,000 BTC, continuing its accumulation strategy during periods of price strength.
This consistent buying pressure from both whales and corporations creates a structural supply squeeze, which often amplifies bullish trends in crypto markets.
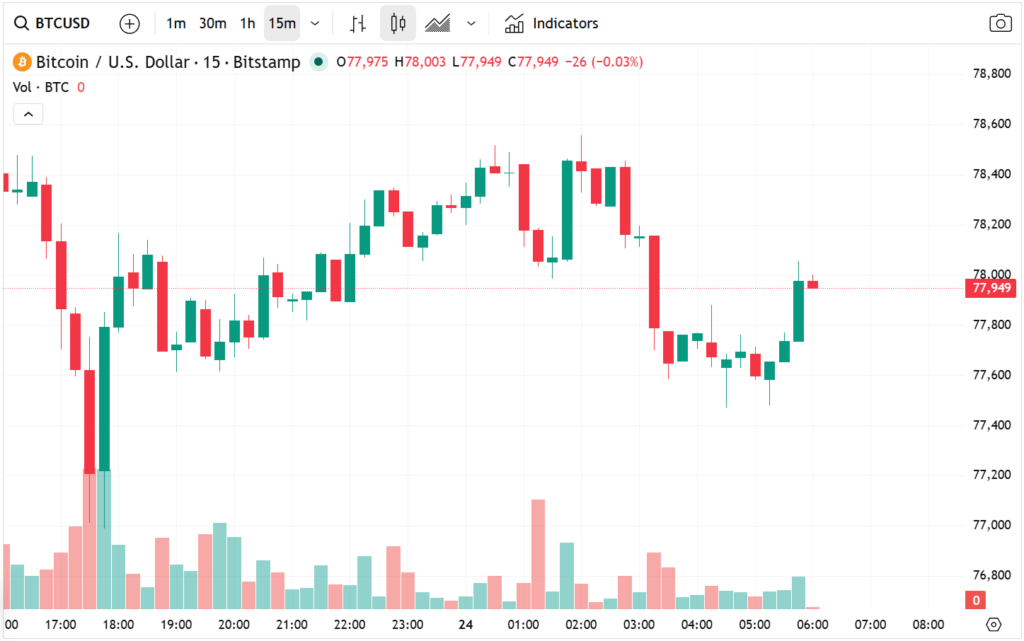
BTC/USD Technical Analysis: Breakout Confirmed
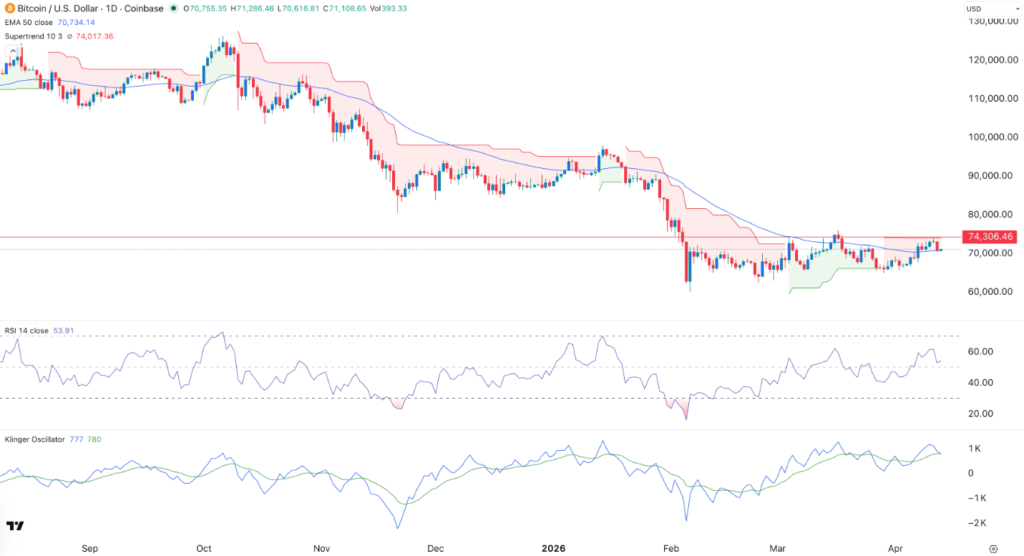
From a technical perspective, the daily chart structure confirms a strong bullish breakout. Bitcoin has rebounded sharply from $60,000 in February to the current level near $79,000, forming a clear higher-high pattern.
A key development is the break above $76,410, which previously represented the March high and acted as a major resistance zone. This breakout now transforms that level into a potential support zone, strengthening the bullish structure.
Bitcoin is also trading comfortably above both the 50-day EMA and the 100-day EMA, confirming that medium-term momentum has turned positive. Additionally, the Supertrend indicator has flipped from red to green, reinforcing the shift in trend direction.
The momentum indicators also remain supportive of the current trend. The Relative Strength Index (RSI) continues to trend higher, reflecting sustained buying pressure without clear signs of immediate exhaustion.
At the same time, the MACD (Moving Average Convergence Divergence) stays in positive territory and is widening, which suggests that bullish momentum is strengthening rather than fading. Taken together, these indicators confirm that Bitcoin is currently in a trend continuation phase, with conditions still favoring upside momentum over a short-term reversal.
Price Outlook and Key Levels
Based on the current market structure, the most likely scenario is a continuation of the upward trend toward the next major resistance zone at $81,000. A clean break above this level could open the door for further upside expansion as momentum accelerates.
On the downside, immediate support is located at $76,400, which now serves as a critical pivot level. A sustained breakdown below this threshold would weaken the bullish structure and could trigger a corrective move back toward lower support zones.
However, as long as Bitcoin remains above its key moving averages and ETF inflows remain strong, the broader outlook remains tilted toward continued upside.
Conclusion: Structural Bull Market Reinforced
The current BTC/USD rally is being driven by a rare alignment of factors: ETF inflows, institutional accumulation, whale buying, and strong technical confirmation. The combination of these forces suggests that Bitcoin is not simply experiencing a short-term rally but potentially entering a more sustained structural bull phase.
While short-term volatility is always possible, the broader market signals indicate that demand continues to outpace supply. If ETF inflows persist and macro sentiment remains supportive, Bitcoin may be well-positioned to challenge and potentially break above the $81,000 resistance level in the near term.


