

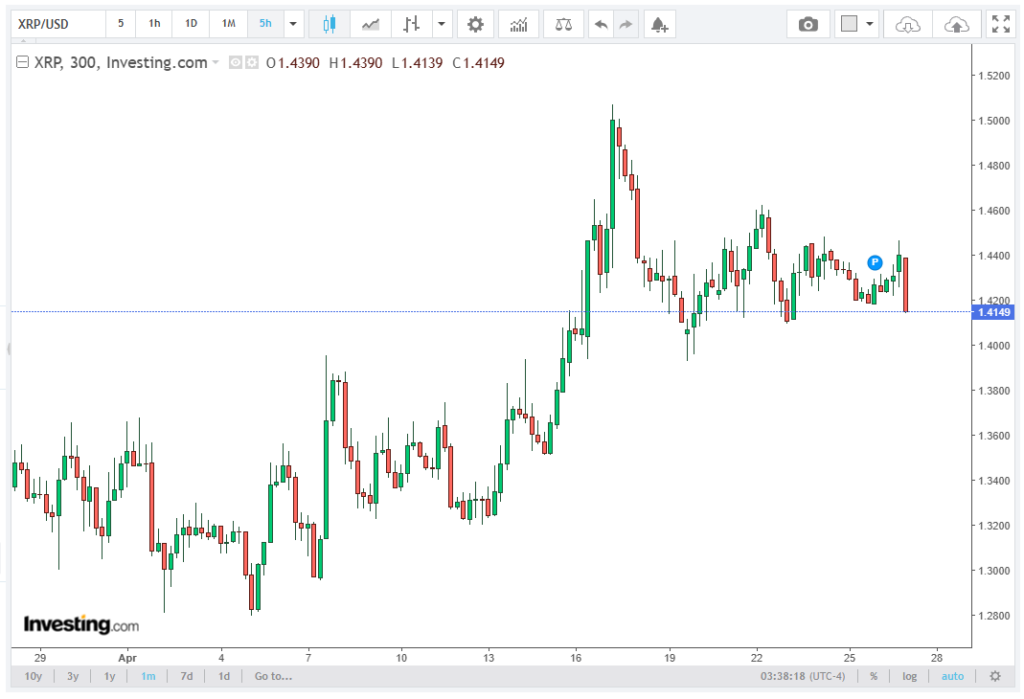
The XRP price has recently demonstrated a steady bullish structure, advancing to a local high of $1.4471 before entering a short consolidation phase. At the time of writing, XRP is trading near $1.44, holding firmly above the 100-hour Simple Moving Average (SMA), a critical short-term trend indicator that often defines directional bias in intraday trading. The article by Achievements AI brokers offers a clear, concise, and well-rounded explanation of this topic.
Importantly, the market is also supported by a developing bullish trend line at $1.4320 on the hourly XRP/USD chart. This confluence of technical support levels reinforces the idea that buyers remain active on dips, maintaining a constructive upward structure despite minor pullbacks.
Bullish Momentum Strengthens With MACD and RSI Confirmation
From a technical standpoint, XRP shows improving momentum indicators, which continue to support the bullish case. The MACD (Moving Average Convergence Divergence) is currently positioned firmly in the bullish zone, indicating that upward momentum is still dominant even during consolidation.
Meanwhile, the RSI (Relative Strength Index) remains above the 50 midpoint level, signaling that buying pressure continues to outweigh selling pressure. This combination of MACD expansion and RSI stability above neutral typically reflects a market in controlled bullish continuation, rather than exhaustion.
Together, these indicators suggest XRP may be preparing for another attempt to break higher, provided key resistance levels are cleared.
Immediate Resistance Cluster at $1.4470–$1.4500
The most critical short-term hurdle for XRP bulls lies in the $1.4470–$1.4500 resistance zone. This region has already acted as a short-term ceiling after XRP printed its recent high at $1.4471, triggering a minor consolidation phase.
A confirmed breakout above $1.4500 would represent a structural shift in intraday momentum, potentially opening the door for continuation toward higher Fibonacci and technical extension targets.
If buyers manage to secure a clean breakout above this resistance band, the next upside objectives would likely shift higher in a structured progression. The first extension target sits at $1.4650, followed by a medium resistance zone at $1.4840, which could act as an interim consolidation area. Above that, the $1.5000 level stands out as a key psychological milestone, often attracting both momentum-driven buying and profit-taking interest.
A further continuation would bring focus to $1.5150, which represents a more significant bullish continuation barrier where stronger supply pressure could emerge before any sustained trend extension.
Price Action and Fibonacci Structure Support Controlled Pullback
XRP’s recent move originated from a swing low at $1.4168, from which the price rallied toward $1.4471, forming a clear upward impulse. During the current consolidation, the price has only retraced modestly toward the 23.6% Fibonacci retracement level, indicating a shallow correction rather than a trend reversal.
This type of retracement behavior is typically associated with strong trending markets, where buyers quickly absorb selling pressure and maintain control of the broader structure.
Additionally, the fact that XRP remains above the 100-hour SMA and trendline support at $1.4320 reinforces the idea that the bullish trend is still intact.
Downside Risk: Failure to Break $1.45 Could Trigger Correction
Despite the bullish structure, XRP remains vulnerable to a technical rejection at $1.4500. If buyers fail to generate sufficient momentum to break this resistance, the market could shift into a deeper corrective phase.
Initial downside support levels are layered in a clear structure. The first line of defense is $1.4400, serving as immediate short-term support where buyers may attempt to stabilize price action. Below that, $1.4320 aligns with a bullish trendline and the 50% Fibonacci retracement zone, making it a technically important reaction area.
Further down, $1.4160 represents a key structural support level tied to the previous breakout base, while the $1.4120–$1.4050 range forms a deeper liquidity support zone where larger bids may cluster. Finally, $1.4000 stands as a major psychological support level, often acting as a critical threshold for broader market sentiment and positioning.
A confirmed breakdown below $1.4320 would weaken the bullish structure and likely signal a transition into a broader consolidation or pullback phase.
Conclusion: XRP at a Technical Crossroads
XRP is currently positioned at a pivotal technical level, trading just below the crucial $1.45 breakout zone. While momentum indicators remain supportive and structural trends are bullish, confirmation is still required.
A decisive move above $1.4500 could unlock further upside toward $1.4650 and beyond, potentially extending toward $1.50–$1.5150 in a sustained bullish continuation. Conversely, rejection at this level may trigger a retracement toward $1.4320 support and lower Fibonacci zones, testing the resilience of the current uptrend.
For now, XRP remains in a tight consolidation phase within a bullish framework, with the next breakout attempt likely to define its short-term directional trajectory.