
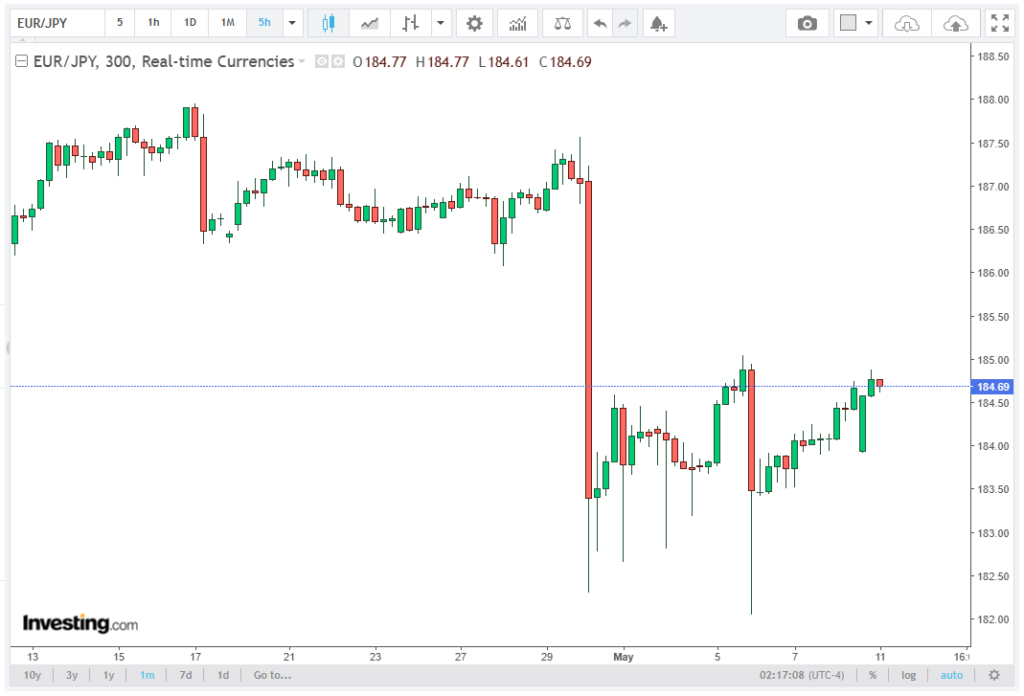
The EUR/JPY currency pair is showing resilience in early trading sessions, extending its winning streak for the third consecutive day. During Asian hours on Monday, the cross hovered around 184.80, signaling cautious optimism among market participants. In the following article, the brokers at Winseterra break down this topic thoroughly.
Technical Indicators Show Momentum Cooling
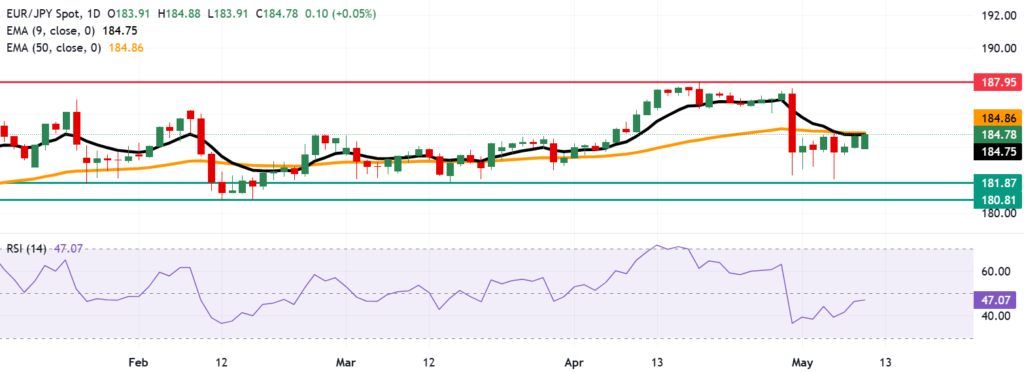
The 14-day Relative Strength Index (RSI) currently sits near 47, suggesting that momentum has eased toward neutral territory. Unlike extreme readings above 70 or below 30, which indicate overbought or oversold conditions, the current RSI reading reflects a balanced market sentiment.
This implies that neither bulls nor bears are in complete control, leaving the currency pair susceptible to directional moves depending on upcoming fundamental catalysts or technical breakouts.
The RSI’s neutral positioning reinforces the view that the EUR/JPY is consolidating within the current range rather than exhibiting strong trending behavior. Traders may interpret this as a sign to wait for confirmation before committing to aggressive positions.
Immediate Resistance at the 50-Day EMA
The EUR/JPY is currently testing immediate resistance at the 50-day EMA of 184.86. This medium-term technical barrier has historically acted as a pivotal level for the pair, influencing short-term trading decisions. A successful breakout above the 50-day EMA would signal renewed bullish momentum, potentially driving the pair toward its all-time high of 187.95, recorded on April 17.
Such a move would likely attract momentum traders, increasing trading volumes and strengthening upward pressure. Market participants will closely watch the pair’s behavior around this key technical hurdle, as it may determine whether the pair enters a sustained uptrend or remains range-bound in the near term.
Support Levels Defined by the Nine-Day EMA
On the downside, the primary support for EUR/JPY lies at the nine-day EMA of 184.75. A sustained break below this short-term average would indicate a shift toward bearish sentiment, potentially triggering a retracement toward lower support zones. Key levels to monitor include the 11-week low of 181.87, recorded on March 16, followed by a five-month low of 180.81, reached on February 12.
These support zones are critical because they represent historical demand levels, where buyers previously stepped in to halt declines. A breach of these levels could accelerate the downside move, drawing in additional selling pressure from technical traders who use moving averages and trendlines as benchmarks for entry and exit.
EMA Squeeze Signals Market Uncertainty
The narrow gap between the nine-day EMA and the 50-day EMA highlights an EMA squeeze, reflecting market indecision. When short-term and medium-term moving averages converge, it often signals that the market is pausing before making a decisive move.
This technical phenomenon suggests that traders are awaiting key triggers, such as economic data releases, central bank commentary, or geopolitical developments, which could influence the EUR/JPY trajectory.
A breakout from this EMA squeeze, either above the 50-day EMA or below the nine-day EMA, would likely define the next directional bias. Traders often use this setup to anticipate volatility expansions, positioning themselves ahead of potential trend continuation or reversal scenarios.
Potential Upside Scenario
In an optimistic scenario, a break above 184.86 would validate the bullish momentum, propelling the pair toward the psychologically significant 185.00 barrier and beyond. Continued upward movement could target the April 17 all-time high at 187.95, providing a technical roadmap for traders looking to capitalize on sustained strength.
Key factors supporting this scenario include strong bullish sentiment from recent consecutive gains, the RSI approaching neutral levels, which leaves room for upside expansion, and medium-term EMA resistance acting as a catalyst for breakout strategies.
Potential Downside Scenario
Conversely, a failure to breach the 50-day EMA could trigger a pullback toward the nine-day EMA at 184.75, marking a short-term bearish shift. Further downside could see the pair testing the 11-week low at 181.87 and the five-month low at 180.81.
Such a scenario would reflect profit-taking or renewed risk-off sentiment, emphasizing the importance of EMA levels as dynamic support and resistance zones. Traders would likely employ stop-loss orders around these key areas to manage risk exposure during a potential downward correction.
Conclusion
The EUR/JPY remains in a technical tug-of-war, balancing above the nine-day EMA while challenging the 50-day EMA barrier near 185.00. The 14-day RSI near 47 underscores a neutral momentum, signaling a market in consolidation rather than extreme positioning. Traders must monitor EMA levels closely, as a decisive break above or below these averages will likely dictate the next directional move.
In summary, the pair is positioned at a critical juncture, with the 50-day EMA acting as resistance and the nine-day EMA providing support. Whether bulls or bears ultimately dominate will depend on the market’s ability to navigate these key technical thresholds, making this a pivotal moment for EUR/JPY traders and strategists alike.