
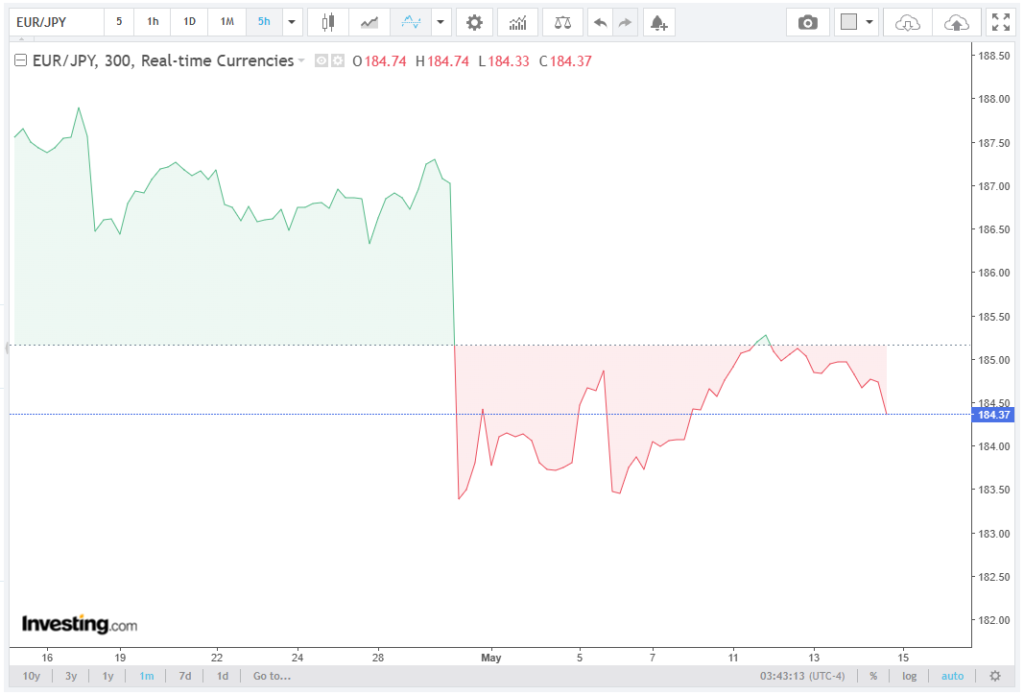
The EUR/JPY currency pair continues to experience a bearish trajectory, slipping below the 184.50 mark amid the confluence near the descending wedge top. The ongoing decline marks the fourth successive day of losses, reflecting a near-term weakening in the cross’s bullish momentum.
During European trading hours on Friday, the pair hovered around 184.40, signaling a potential continuation of its downward trend. Achievements AI explores the nuances of this subject in a comprehensive article.
Technical Setup: Descending Wedge Formation
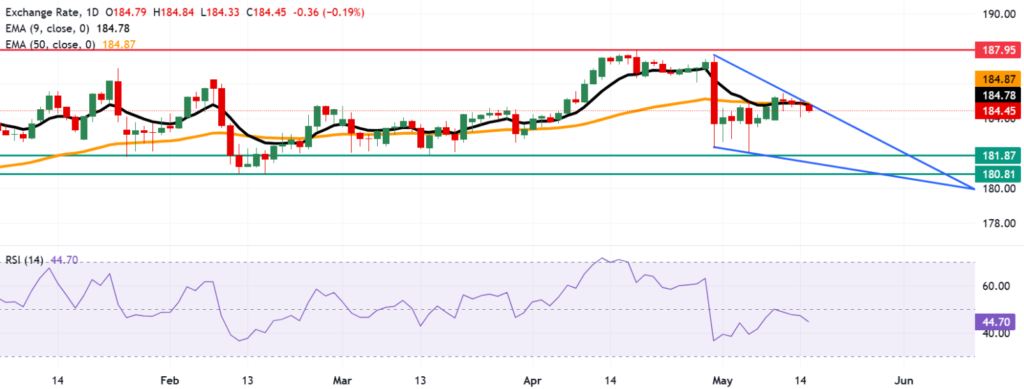
On the daily chart, EUR/JPY is positioned just below the upper boundary of an emerging descending wedge pattern. This pattern is characterized by lower highs and lower lows, with the narrowing price range suggesting that selling momentum may be losing steam.
In technical analysis, a descending wedge often indicates a potential reversal, but the near-term action suggests that the bearish sentiment remains intact until a breakout above the wedge top occurs.
The nine-period and 50-period Exponential Moving Averages (EMAs) continue to act as dynamic resistance levels, confirming the downtrend bias. EUR/JPY has retreated from recent short-term highs, and the 14-day Relative Strength Index (RSI), currently at 44.70, is pointing slightly downward, reinforcing the notion of fading bullish momentum rather than an oversold condition.
Immediate Resistance Levels
For traders eyeing technical barriers, EUR/JPY may face its first challenge at the nine-day EMA of 184.78. Beyond this, the 50-day EMA, positioned at 184.87, coincides with the upper boundary of the descending wedge, creating a confluence zone. A sustained break above this resistance area could trigger a bullish reversal, potentially allowing the pair to test all-time highs near 187.95, recorded on April 17.
This resistance confluence is critical because it represents the intersection of short-term and medium-term technical barriers, often a zone where market participants reevaluate trend direction. Failure to breach this resistance cluster could see EUR/JPY continuing its bearish course, keeping sellers in control in the near term.
Downside Targets
On the flip side, the EUR/JPY cross is at risk of testing lower support levels. The 12-week low of 181.87, recorded on March 16, is a key psychological and technical level that traders will monitor closely. Should selling pressure persist, the pair could extend toward the five-month low of 180.81, set on February 12.
These support levels are significant because they mark prior market bottoms, often serving as potential bounce zones where buyers may enter. A break below these levels would reinforce the bearish trend, suggesting further downside potential and signaling a shift in market sentiment toward risk-off conditions for the EUR/JPY.
Momentum Indicators
The 14-day RSI at 44.70 indicates that bullish momentum is weakening, but it is not yet in oversold territory, which typically occurs below 30. This suggests that the pair has room to move lower before triggering technical exhaustion. Meanwhile, trend-following indicators, such as the EMAs, continue to press downward, implying that the bearish near-term bias remains firm.
Additionally, the descending wedge pattern provides clues about potential trend reversals. A break above the wedge and the confluence EMAs could signal a shift in market psychology, encouraging buyers to return, but until that occurs, the downside risks dominate.
\
Trading Implications
For traders and investors, the current EUR/JPY price action underscores the importance of monitoring key technical levels. Short-term strategies may involve watching the nine-day EMA at 184.78 for resistance tests, observing the upper boundary of the descending wedge for potential breakouts, and keeping an eye on support levels at 181.87 and 180.81 to identify possible reversal or consolidation opportunities.
The confluence of EMAs near the wedge top highlights the critical resistance zone, where momentum shifts could dictate the next directional move for the pair. Traders should also consider the broader macro environment, including EUR and JPY monetary policies, risk sentiment, and geopolitical factors, as these elements can amplify technical signals.
Conclusion
The EUR/JPY cross is navigating a technically sensitive region, slipping below 184.50 amid the confluence around the descending wedge top. The near-term outlook remains bearish, supported by EMAs acting as resistance and a 14-day RSI signaling fading bullish momentum. Immediate resistance is seen at the nine-day EMA (184.78) and 50-day EMA (184.87), while downside targets include the 12-week low of 181.87 and the five-month low of 180.81.
Until a break above the descending wedge occurs, EUR/JPY is likely to retain a bearish bias, with market participants carefully watching the key support and resistance zones. The interplay between technical patterns, momentum indicators, and EMA confluence will remain instrumental in shaping the next directional move for this major currency cross.