
Bitcoin (BTC) recently made headlines after briefly dipping below the $80,000 support level, sparking questions about the sustainability of its ongoing rally. Despite this minor pullback, market data and whale activity suggest that the $80K threshold is not as critical as many traders believe.
In fact, the cryptocurrency’s recent behavior signals that the rally remains intact and could continue toward new highs in the coming days. Achievements AI breaks down the complexities of this subject in an informative article.
Whales Are Accumulating BTC
One of the most important drivers of Bitcoin’s price action is whale activity. According to Santiment, wallet addresses holding between 10 and 100,000 BTC have purchased 20,000 tokens so far this month. This equates to roughly $1.6 billion in capital inflows, adding to nearly $4 billion acquired last month.
Such accumulation signals strong institutional confidence, as deep-pocketed players are effectively preparing for the next leg up. When whales accumulate at current levels, smaller traders often follow their lead, which can amplify upward momentum.
Why the $80K Level Is Overemphasized
Despite its psychological significance, the $80,000 support level is not a make-or-break point for BTC. The recent dip below this mark lasted only briefly before buyers stepped in, pushing the price back to nearly $82,000. This rapid recovery reflects a build-up of bids and demonstrates that the market is still in an early-stage rally phase.
Technical indicators also support this view. BTC recently tested the 200-day exponential moving average (EMA) for the second time, an event that historically attracts strong buying interest. This level serves more as a dynamic resistance point than a strict floor, and surpassing it could spark a significant breakout.
Market Sentiment: Neutral but Improving
The Crypto Fear and Greed Index currently sits at 50 (Neutral), though it previously spiked to 62, marking the highest level since October 2025. This suggests that traders are cautiously returning to the market after a period of hesitation.
Meanwhile, BTC futures open interest (OI) has surged to $64 billion, the highest since January 2026 when Bitcoin traded around $96,000. Increased OI indicates that traders are positioning for further upward movement, setting the stage for either a breakout or a controlled pullback.
Technical Setup: RSI and EMAs Signal Opportunity
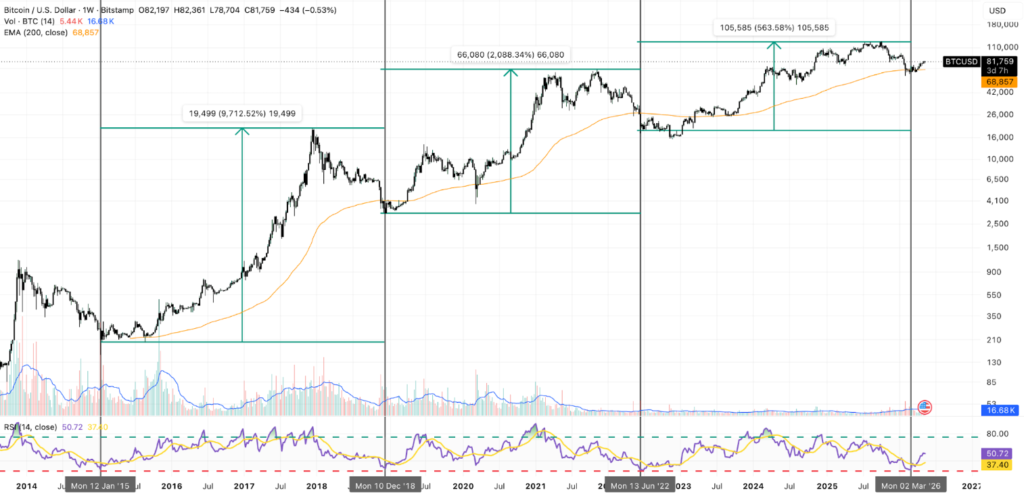
On the weekly chart, Bitcoin triggered a major buy signal when the Relative Strength Index (RSI) dropped below 30 in March 2026, a phenomenon not seen since June 2022. Historically, such oversold conditions have led to substantial gains, although the magnitude of these gains has gradually decreased.
A subsequent RSI crossover above the signal line confirmed a bullish cycle, coinciding with a strong bounce off the 200-week EMA. The primary technical risk remains a retest of the 50-week EMA from below, a level whose breach in the past resulted in a 60% drawdown. Fortunately, strong support around $67,000 has prevented such a scenario so far.
Short-Term Outlook: $85K or $77K
Traders are now watching the daily chart closely. The immediate support lies at $77,000, BTC’s previous resistance. Should the market pull back to this level, it would offer a prime buying opportunity for late entrants.
On the upside, a decisive break above the 200-day EMA could drive Bitcoin toward $85,000 in the coming days. The market is currently at a critical juncture, making it an either-or scenario: either a strong breakout or a controlled retracement to support.
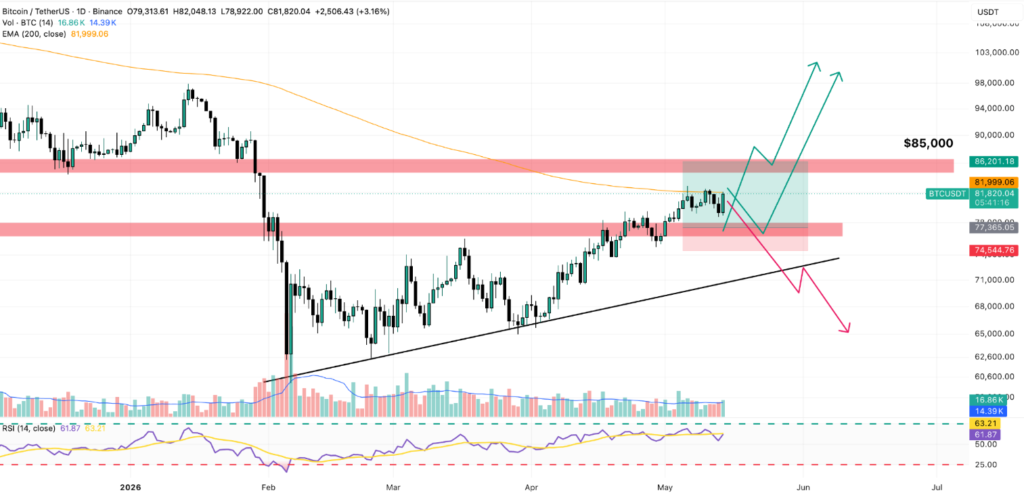
The next key support beyond $77,000 is the trend line at $72,000, followed by the $67,000 floor, where the 50-week EMA currently resides. A failure to hold these levels could signal bearish dominance, but indicators suggest this is a less likely outcome.
Why $100K is Within Reach
The combination of whale accumulation, technical buy signals, and gradually returning trader confidence sets the stage for Bitcoin to challenge triple-digit territory. If BTC clears the 200-day EMA, it could catalyze a broader market rally and potentially invalidate the bearish thesis surrounding the 50-week EMA.
Historically, similar conditions have led to 200–300% gains over 12–24 months, making this an opportune moment for investors with a medium- to long-term horizon.
Conclusion
In summary, Bitcoin’s brief dip below $80K is not a cause for alarm. Strong whale accumulation, a healthy RSI setup, and resilient support levels suggest that the rally is far from over. Traders should monitor the 200-day EMA closely, as a breakout above this level could push BTC toward $85,000, while a controlled pullback may test $77,000.
Market participants are returning gradually but steadily, making this an ideal environment to accumulate positions in anticipation of the next bullish phase. Losing $80K may grab headlines, but the structural underpinnings of Bitcoin’s rally remain solid.