
The GBP/USD exchange rate experienced a modest pullback on Thursday, reflecting heightened market sensitivity to geopolitical developments and fresh macroeconomic data. The pair declined to a low of 1.3500, retreating from its recent monthly high near 1.3570. Despite this short-term weakness, the broader technical structure remains supportive of a bullish continuation, particularly as key support levels hold firm.
Currency markets are currently navigating a complex intersection of geopolitical risk, inflation dynamics, and central bank expectations, all of which are influencing directional bias in the forex market. Fondesia’s team breaks down this topic clearly and thoroughly in their article.
UK Inflation Rises Amid Geopolitical Tensions
A key driver behind recent GBP/USD volatility is the ongoing US-Iran conflict, which continues to disrupt global markets. The extension of the ceasefire has done little to stabilize sentiment, as uncertainty remains elevated. Compounding this issue, Iran’s actions in the Strait of Hormuz, a critical global oil transit chokepoint, have triggered a sharp rise in crude oil prices.
Higher energy costs are feeding directly into inflationary pressures in both the UK and the US. According to the latest data, the UK’s headline Consumer Price Index (CPI) rose from 3.0% in February to 3.3% in March, signaling persistent upward price pressure. Meanwhile, core inflation, which strips out volatile components like food and energy, eased slightly to 3.1%, suggesting that underlying inflation may be stabilizing.
Upcoming PMI Data as a Key Catalyst
Looking ahead, traders are closely watching the release of Purchasing Managers’ Index (PMI) data from both the UK and the US. These indicators provide valuable insights into economic activity across the manufacturing and services sectors.
In the UK, expectations suggest a slight deterioration in business activity. The manufacturing PMI is projected to decline from 51.0 to 49.9, potentially slipping into contraction territory. Similarly, the services PMI is expected to edge lower from 50.5 to 50.0, indicating stagnation.
In contrast, the US economy appears more resilient. Forecasts indicate that the US manufacturing PMI could improve from 52.3 to 52.5, while the services PMI may rebound from 49.8 to 50.0, crossing back into expansion territory.
This divergence in economic momentum could influence relative currency strength, though the impact may be offset by broader risk sentiment tied to geopolitical developments.
Technical Analysis: Break-and-Retest Pattern Signals Strength
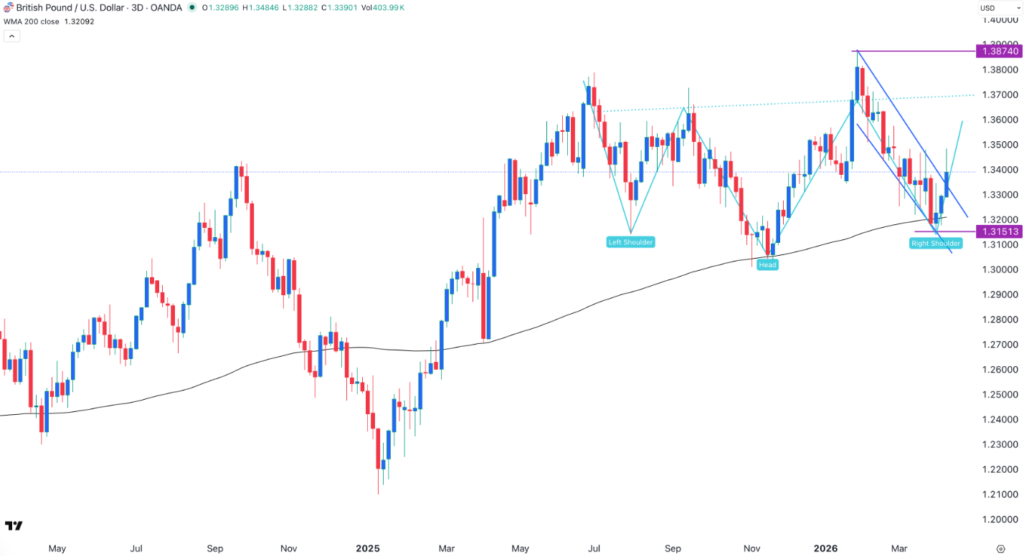
From a technical analysis perspective, the GBP/USD pair continues to exhibit a strong bullish structure. On the daily timeframe, the pair has staged an impressive recovery from its March low of 1.3162, climbing to a recent high near 1.3596.
A key development is the recent pullback and retest of the support level at 1.3475. This level previously acted as resistance on March 10 and March 23, and its successful retest now reinforces it as a strong support zone. The break-and-retest pattern is widely regarded as a continuation signal, suggesting that the prevailing uptrend is likely to persist.
Further supporting the bullish outlook, the pair remains above both the 50-day Exponential Moving Average (EMA) and the 100-day EMA. These indicators are commonly used to gauge trend direction, and their alignment below current price levels confirms ongoing upward momentum.
Additionally, the chart reveals the formation of an inverted head-and-shoulders pattern, a classic bullish reversal formation. This pattern typically signals the transition from a downtrend to an uptrend and often precedes significant price advances once the neckline resistance is broken.
Bullish Outlook and Key Levels to Watch
Given the convergence of technical signals and relatively stable fundamental conditions, the GBP/USD pair appears poised for further gains. The immediate upside target is the recent high at 1.3595. A decisive break above this level would likely confirm continued bullish momentum and open the door to a move toward the 1.3600 psychological level.
Beyond that, sustained strength could attract additional buy-side liquidity, potentially driving the pair higher in the medium term. However, traders should remain cautious of volatility spikes driven by geopolitical headlines or unexpected economic data releases.
On the downside, the 1.3475 support level remains critical. A break below this zone could invalidate the bullish scenario and signal a deeper correction.
Conclusion
In summary, while short-term pressure on GBP/USD reflects ongoing geopolitical uncertainty and mixed economic signals, the broader technical outlook remains decisively bullish. The presence of a break-and-retest formation, alignment above key moving averages, and a confirmed inverted head-and-shoulders pattern all point toward continued upside potential.
As markets digest incoming PMI data and monitor developments in the US-Iran conflict, traders should focus on key technical levels and maintain awareness of shifting macroeconomic conditions. For now, the balance of evidence supports an extremely bullish forecast for GBP/USD in the near term.