
Gold (XAU/USD) slipped to a two-week low around the $4,758–$4,757 region during Friday’s Asian session, extending its downside momentum and positioning itself for its first weekly loss in five weeks. The broader tone remains decisively bearish, with sellers maintaining control as macroeconomic and geopolitical drivers continue to favor the US Dollar (USD) over the non-yielding metal.
The prevailing market structure reflects a combination of geopolitical uncertainty, inflation-driven rate expectations, and a technically deteriorating setup, all aligning to reinforce downside pressure on gold prices. The article from Fondesia’s team presents a clear and detailed overview of this topic.
Inflation Expectations and Fed Outlook: Hawkish repricing supports USD
Another critical macro driver is the resurgence of inflationary fears, triggered by potential disruptions in global energy supply chains through the Strait of Hormuz. Persistent tensions in this region have helped keep crude oil prices elevated, raising concerns about a broader inflation spillover across developed economies.
Rising inflation expectations are directly influencing monetary policy outlooks, particularly for the US Federal Reserve (Fed). Market pricing has recently shifted toward a more cautious view on easing cycles, with expectations now suggesting only a single 25-basis-point rate cut in 2026.
This repricing carries several important market implications. It supports the narrative of higher-for-longer interest rates, as markets adjust expectations toward sustained restrictive monetary policy.
At the same time, it contributes to elevated US Treasury yields, reflecting increased returns demanded by investors in response to tighter financial conditions. In parallel, this environment tends to boost US Dollar (USD) demand, as higher yields and relative monetary tightening make the dollar more attractive compared to other currencies.
Technical Analysis: Bearish structure dominates XAU/USD
From a technical perspective, XAU/USD continues to trade under a clearly defined bearish configuration, with price action trending below key dynamic resistance levels.
The metal remains capped beneath the 200-period Exponential Moving Average (EMA), a widely watched indicator of medium-term trend direction. This positioning confirms that momentum remains firmly in favor of sellers.
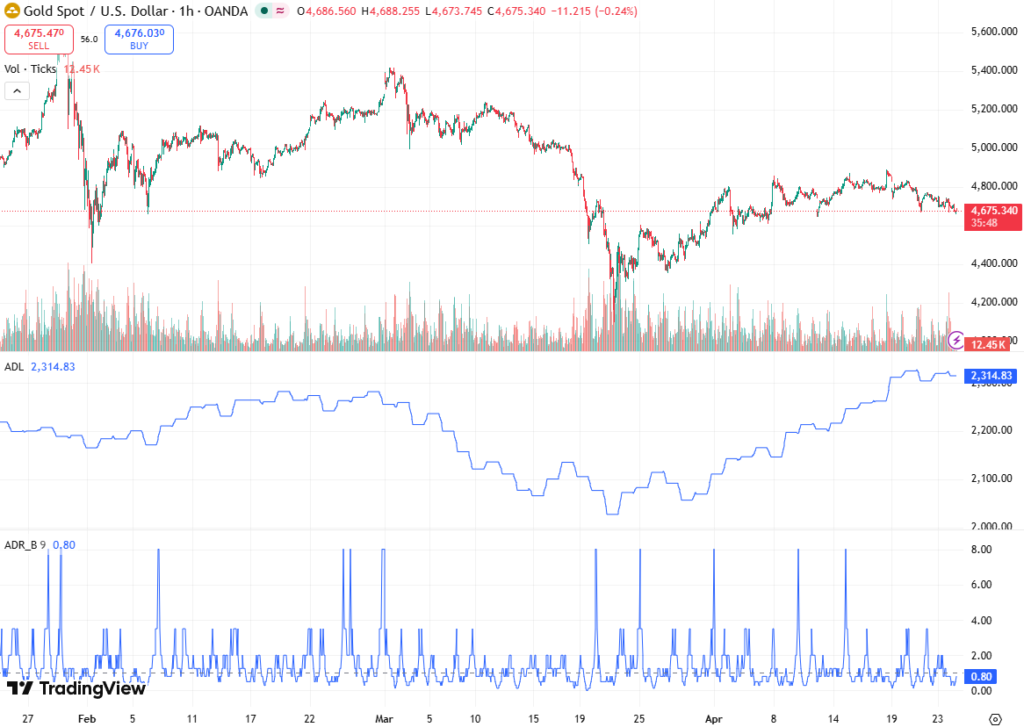
More importantly, price has now broken below the lower boundary of its ascending channel, located around $4,680.47. This breakdown signals a potential loss of bullish structure, suggesting that upward momentum has exhausted itself.
Momentum Indicators: RSI and MACD reinforce downside bias
The momentum signals further reinforce the bearish outlook. The Relative Strength Index (RSI) is currently near 35.72, sitting close to oversold territory, which may indicate some short-term exhaustion in selling pressure; however, it does not yet provide a clear reversal signal.
At the same time, the Moving Average Convergence Divergence (MACD) remains firmly negative, with a sub-zero reading around -4.92, highlighting continued downward momentum in the market.
Importantly, neither indicator is showing early signs of bullish divergence, meaning there is currently no strong technical evidence of a trend reversal. Instead, both the RSI and MACD suggest that the prevailing downtrend remains intact, with momentum still favoring further downside pressure unless a clear structural shift emerges.
Key Technical Levels: Resistance and downside targets
The current technical structure defines several key levels of interest for traders. On the upside, immediate resistance is seen at $4,680.47, which previously acted as channel support and is now functioning as resistance.
The next level is $4,778.44, aligned with the 200-period EMA, making it an important dynamic resistance zone. Above that, a stronger resistance area sits at $4,901.82, which marks the upper boundary of the former ascending channel.
A sustained breakout above these levels would be necessary to neutralize the current bearish structure and could open the door to a potential short-term reversal. On the downside, however, failure to reclaim these broken support zones leaves XAU/USD exposed to further depreciation, with the possibility of continued price discovery to the downside as bearish momentum builds.
Market Outlook: Path of least resistance remains lower
Looking ahead, the fundamental and technical alignment suggests that the path of least resistance for gold remains to the downside. While geopolitical risks remain elevated, their effect is currently skewed toward supporting the US Dollar rather than gold itself, a notable divergence from traditional safe-haven behavior.
Combined with a hawkish repricing of Fed expectations, elevated real yields, and a confirmed technical breakdown, the market structure continues to favor bearish continuation.
Conclusion
Gold’s decline to a two-week low reflects a powerful convergence of geopolitical tension, inflation-driven monetary tightening expectations, and technical deterioration. With the USD strengthening, Fed rate-cut expectations subdued, and key support levels broken, the XAU/USD bears retain firm control.
Unless macro conditions shift decisively or technical resistance is reclaimed, gold remains exposed to further downside risk in the near term, with sellers continuing to dominate price action across global markets.