
The US Dollar Index (DXY), which measures the Greenback against a basket of six major currencies, is attempting to stabilize above the 20-day exponential moving average (EMA) following a three-day rally. In Friday’s Asian session, the index trades near the weekly high around 99.00, signaling that bullish momentum remains intact but is entering a consolidation phase. Fondesia’s article delivers a thorough and well-structured explanation of this topic.
This stability comes amid a complex macroeconomic environment where energy markets, geopolitical risk, and monetary policy expectations are simultaneously shaping USD demand.
Energy Shock Supports US Dollar Strength
A key driver behind the recent US Dollar appreciation is the sustained strength in global energy prices, particularly crude oil. The DXY has found indirect support as higher oil prices reinforce inflationary pressures, reducing expectations for imminent policy easing from the Federal Reserve.
At the center of market concern is the risk of a prolonged disruption in the Strait of Hormuz, a strategic maritime chokepoint responsible for nearly 20% of global energy flows. Investors are increasingly pricing in supply chain fragility, which has boosted safe-haven demand for the US Dollar.
At the time of writing, WTI crude oil trades near $95.00, relatively flat on the day but still significantly elevated after a sharp rally. Importantly, oil prices have surged nearly 20% from their April 17 low of $78.88, underscoring how quickly energy markets have repriced geopolitical risk.
Geopolitical Risk: US-Iran Tensions Intensify Market Volatility
The latest round of dollar support is closely tied to stalled US-Iran peace negotiations, which have failed to generate meaningful progress. Tehran’s reluctance to resume talks with Washington has heightened fears of a prolonged disruption in Middle Eastern energy logistics.
The continuation of US restrictions on Iranian maritime access has contributed to escalating tensions, further increasing the probability of a supply-side shock in global oil markets. For currency markets, this environment typically benefits the USD due to its role as a global reserve currency and safe-haven asset.
Federal Reserve Outlook: Rates Expected to Stay on Hold
Monetary policy expectations remain another critical driver of the US Dollar Index directionality. Markets broadly expect the Federal Reserve (Fed) to maintain its benchmark interest rates unchanged in its upcoming policy meeting on Wednesday.
This “higher-for-longer” stance has been reinforced by recent inflation dynamics, particularly the pass-through effect of rising energy costs. Higher oil prices have de-anchored inflation expectations, reducing the probability of near-term rate cuts.
Traders are now closely monitoring US inflation expectations data, including the University of Michigan (UoM) one-year and five-year Consumer Inflation Expectations. Any upside surprise could further support the US Dollar’s yield advantage narrative.
US Dollar Index Technical Analysis: Consolidation Above Key EMA
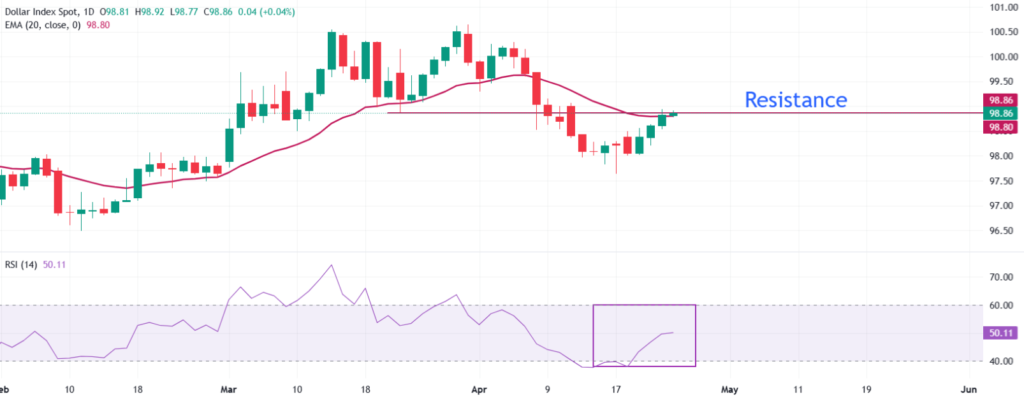
From a technical standpoint, the US Dollar Index Spot is trading around 98.86, holding just above the critical 20-day EMA at 98.80. This level now acts as a dynamic support zone, and its defense is crucial for maintaining the short-term bullish structure.
The broader price action reflects a market in consolidation, following a recent rebound from lower levels. The inability to break decisively higher suggests that traders are awaiting fresh macro catalysts, particularly from central bank guidance.
Momentum Indicators Signal Neutral Bias
The Relative Strength Index (RSI 14) stands at 50.11, sitting almost exactly at the midpoint. This reading indicates a neutral momentum environment, with neither buyers nor sellers currently in control.
Such RSI behavior is typical during periods of post-rally consolidation, where the market digests recent gains before establishing a new directional trend. In this context, the DXY remains vulnerable to range-bound trading unless a strong catalyst triggers renewed momentum.
Key Support and Resistance Levels
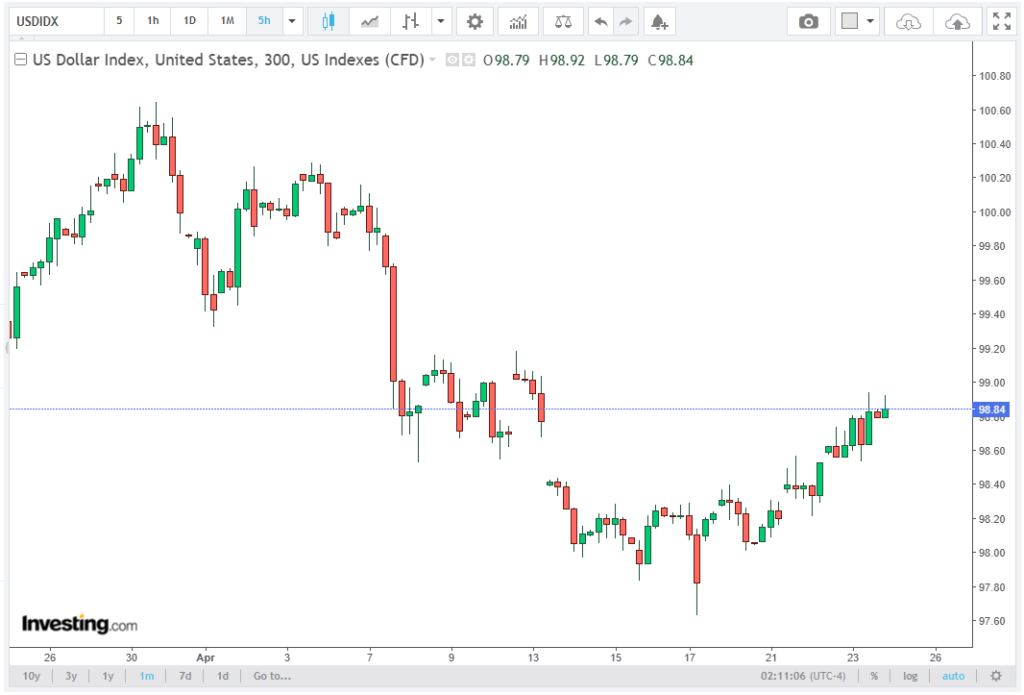
On the downside, immediate support is seen at the April 23 low of 98.53, followed by a deeper support zone at the April 21 low near 98.00. A break below this level would signal weakening bullish structure and could expose further downside risk.
On the upside, the first major resistance lies at the April 9 high of 99.16. A sustained breakout above the 20-day EMA and the 99.00 psychological level would likely confirm renewed bullish momentum.
Beyond that, the next significant resistance is located at the April 8 high near 99.70, which represents a key technical barrier for any medium-term bullish extension.
Outlook: Dollar Stabilization with Bullish Bias Intact
Overall, the US Dollar Index forecast suggests a period of controlled consolidation above the 20-day EMA, with a slight bullish bias. The combination of elevated energy prices, geopolitical instability, and firm Fed policy expectations continues to support the Greenback.
However, the market remains highly sensitive to upcoming catalysts, particularly the Fed policy decision and inflation expectations data. A decisive breakout above 99.16 would strengthen the bullish outlook, while a break below 98.50 could shift momentum back toward a corrective phase.


