
After a period of short-lived recovery, the US Dollar Index (DXY) appears to be settling into a more stable range. This index tracks the strength of the US Dollar (USD) by comparing it against a basket of six key global currencies.
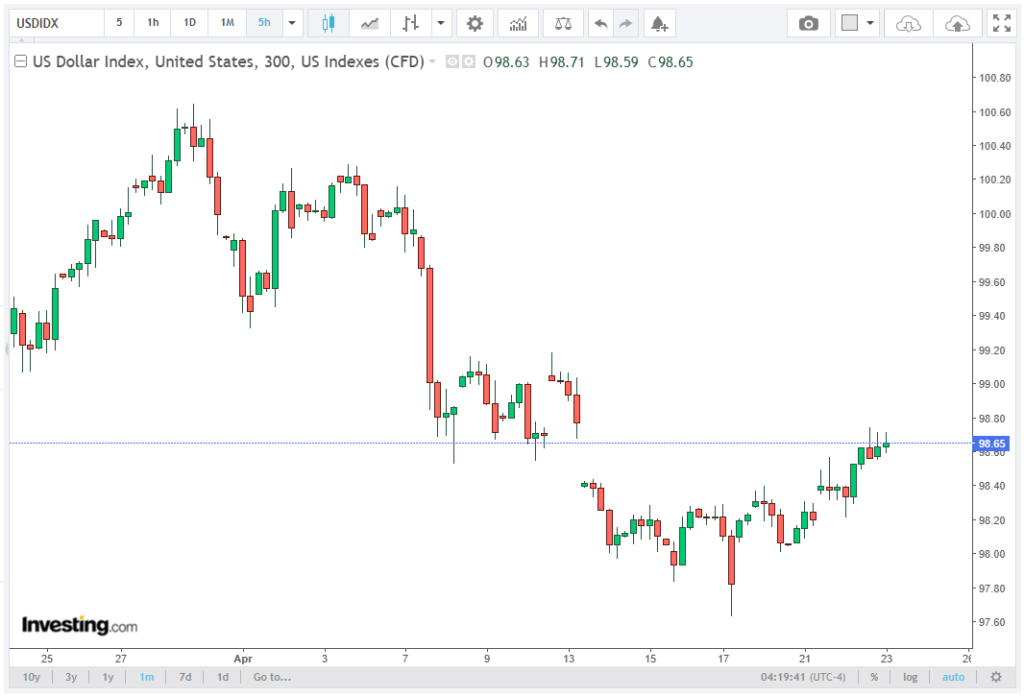
During early European trading hours on Thursday, the index is holding around 98.60, extending gains for a second consecutive session. This positioning above the psychologically important 98.50 level suggests that the dollar is attempting to build a base following recent weakness.
From a broader technical perspective, the index is still operating within a descending channel, but price action has recently pushed slightly above its upper boundary. This development introduces the possibility of a bullish reversal, although confirmation remains limited at this stage. The team at Achievements AI provides an engaging and detailed explanation of this subject in their article.
Momentum Indicators and RSI Analysis
A critical component of the current technical setup is the 14-day Relative Strength Index (RSI), which is currently positioned at 46.72. This reading sits just below the neutral 50 threshold, indicating that momentum remains subdued but not oversold.
An RSI below 50 typically signals that bearish forces still have a marginal edge; however, the lack of strong downward pressure suggests that selling momentum is fading. In practical terms, this creates conditions where a bullish reversal scenario becomes more probable, especially if buyers manage to reclaim key resistance levels.
The RSI also supports the broader interpretation that the recent pullback in the DXY is more corrective than impulsive, meaning the market may be preparing for a directional shift rather than continuing its decline.
Key Support Levels and Downside Risk
The most immediate and technically significant support level for the US Dollar Index is the nine-day EMA at 98.51. This level aligns closely with the upper boundary of the former descending channel, making it a critical pivot point for short-term direction.
A sustained break below 98.51 would likely invalidate the early bullish signals and reassert bearish control. In such a scenario, the index could re-enter the descending channel and resume downward pressure.
If selling intensifies, the next major downside target lies near 97.00, which corresponds to the lower boundary of the descending channel. This level represents a key structural support zone where buyers may attempt to re-enter the market.
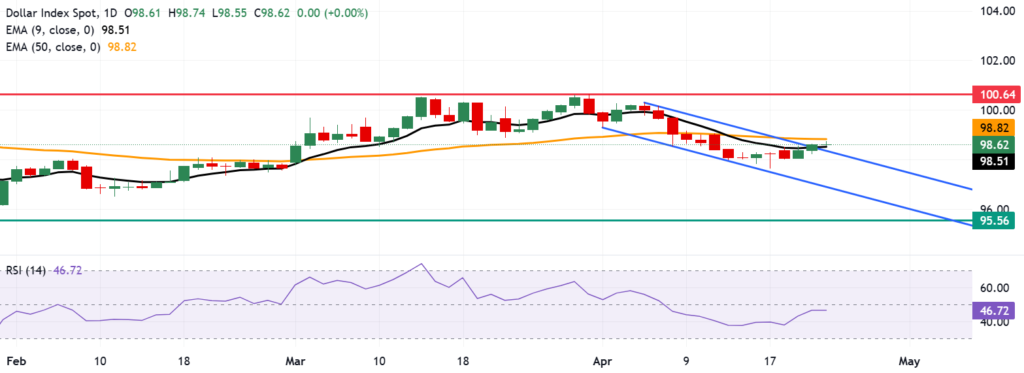
Beyond that, a more significant long-term support area is located at 95.56, the lowest level recorded since February 2022. This level was last tested on January 27 and represents a critical long-term floor. A breakdown toward this zone would signal a broader structural weakening of the US Dollar trend.
Resistance Levels and Recovery Potential
On the upside, the immediate barrier for the DXY is the 50-day EMA at 98.82. This level is particularly important because it represents the dividing line between short-term bearish and medium-term neutral-to-bullish sentiment.
A sustained breakout above 98.82 would be a strong technical signal that buyers are regaining control. Such a move would likely shift market sentiment toward a more constructive outlook for the dollar.
If bullish momentum strengthens further, the index could target the 10-month high at 100.64, which was last recorded on March 31. This level serves as a major resistance zone and would likely require significant macroeconomic or policy-driven catalysts to be breached.
Market Outlook and Scenario Analysis
The current technical configuration places the US Dollar Index in a transitional phase. While the broader structure still reflects a downtrend within a descending channel, recent price behavior suggests that downside momentum is losing strength.
The combination of price holding above 98.50, RSI stabilizing near neutral at 46.72, and early breakout attempts above the channel all contribute to the possibility of a bullish reversal scenario forming.
Together, these signals suggest improving momentum conditions, with price stability above key support and neutral RSI readings indicating there is room for upside continuation if buying pressure strengthens.
However, confirmation is essential. Without a decisive break above the 50-day EMA at 98.82, any upward movement risks being classified as a temporary correction rather than a trend reversal.
Conclusion
In summary, the US Dollar Index (DXY) is currently positioned in a delicate technical balance. Trading above 98.50, the index shows early signs of stabilization and potential bullish reversal, but confirmation remains pending.
The market is closely watching the interaction between price and the nine-day EMA at 98.51, as well as the critical 50-day EMA resistance at 98.82. Meanwhile, the RSI at 46.72 continues to reflect subdued momentum, reinforcing the view that the recovery lacks strong conviction.
Until a clear breakout occurs, the US Dollar Index is expected to remain range-bound with a slight bearish bias, but increasingly sensitive to upside breakout potential.