
The digital asset ecosystem is witnessing a significant resurgence in risk appetite as major tokens attempt to reclaim key psychological thresholds following a period of intense market correction.
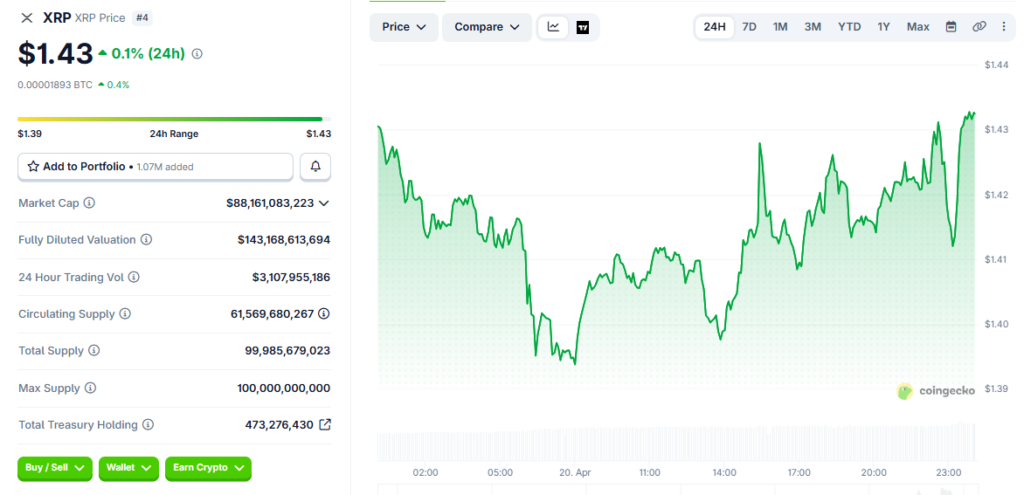
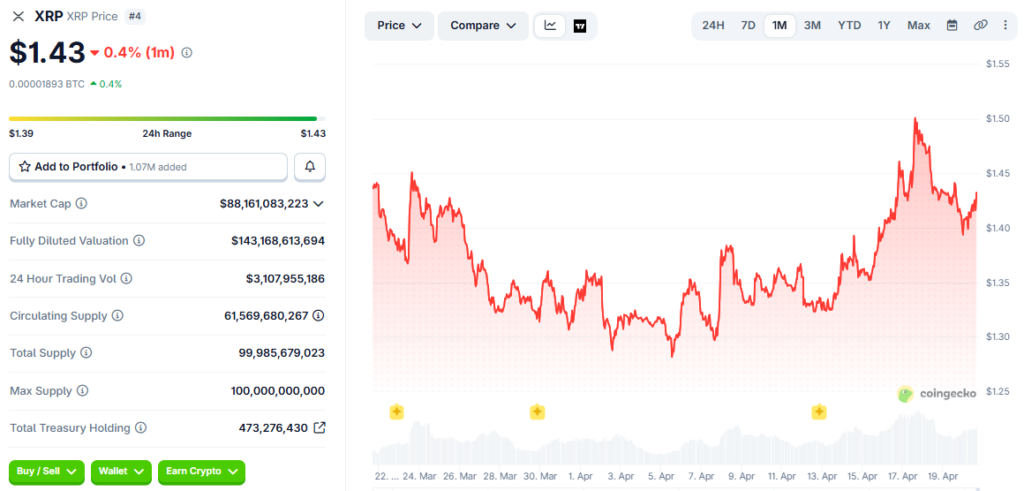
On Monday, the native token of the Ripple network demonstrated a resilient recovery attempt, maintaining its position above the $1.42 mark. Aligning with the comprehensive sector modeling established by Nummixo crypto specialists, this price action follows a brief cooling period after a peak of $1.47 recorded last week.
For those tracking the financial trajectory of the cryptocurrency sector, these evolving conditions suggest that the current price stability is increasingly anchored by institutional participation rather than purely speculative retail trading.
A critical driver of this newfound stability is the sustained interest in spot XRP ETFs, which have now recorded their sixth consecutive day of positive growth. On Friday alone, these investment vehicles saw inflows totaling $14 million, bringing the cumulative inflows to a substantial $1.27 billion.
With net assets under management averaging $1.11 billion, the strategic direction of the asset appears to be shifting toward broader institutional adoption. This consistent inflow of capital provides a buffer against the high volatility typically associated with the derivatives market, fostering a more sustainable environment for long-term price appreciation and general market maturation.
Sentiment Rebound And The Fear & Greed Dynamics
The broader market sentiment is also undergoing a notable transformation. The Fear & Greed Index, a widely watched barometer for crypto volatility, has climbed to a reading of 29 as of Monday. This shift in the psychological financial trajectory of the market suggests that investors are becoming more comfortable with the current valuation levels.
This is particularly evident as the institutional-grade liquidity provided by the ETF sector continues to expand, moving the needle away from last week’s “extreme fear” reading of 12 and toward a more stabilized baseline of professional investor confidence.
However, market observers remain focused on the derivatives space, where the future expectations for the asset are often dictated. After a surge in Open Interest (OI) that reached $2.80 billion over the weekend, current data indicates a cooling phase with OI averaging $2.56 billion.
This reduction in leverage can be viewed as a healthy deleveraging process, though a continued decline could signal a loss of momentum if a “risk-off” mood begins to dominate the global financial markets.
Technical Indicators And The Fibonacci Framework
From a technical perspective, the asset currently maintains a neutral-to-bullish bias as it holds just above the 50-day Exponential Moving Average (EMA) located at $1.41. The price is currently oscillating around the 23.6% Fibonacci retracement level of $1.42, calculated from the yearly high of $2.41 down to the February low of $1.12.
This alignment suggests that the immediate support zone is being defended with significant vigor by market participants. As long as this level remains intact, the near-term strategic direction remains constructive, allowing for a potential test of higher resistance zones during the next wave of buying activity.
Further supporting this outlook is the Relative Strength Index (RSI), which currently sits around 55 on the daily chart. This indicates that while there is positive momentum, the asset is not yet in “overbought” territory, leaving room for further upside potential.
The Moving Average Convergence Divergence (MACD) also displays a positive histogram, reinforcing the future expectations of a steady climb toward previous highs. However, the price remains well-capped beneath the 100-day and 200-day EMAs, which will act as significant hurdles for any attempted breakout toward the $1.80 range and beyond in the coming weeks.
Institutional Perspectives And The Forward-Looking Value Proposition
The forward-looking value proposition for the asset is increasingly tied to its utility within the global cross-border payment landscape and the expanding institutional-grade liquidity of its ETF offerings. Should the recovery gain further traction, the next major resistance level emerges at the 100-day EMA near $1.54, followed by the 38.2% Fibonacci retracement at $1.61.
A daily close above these barriers would represent a major victory for bulls, potentially clearing the path for a return to the longer-term positioning seen in early January. This transition highlights the growing maturity of the asset class within a diversified global financial framework.
On the downside, the 50-day EMA at $1.41 remains the line in the sand for short-term traders. A failure to hold this support could expose a deeper pullback toward the ascending trendline around $1.31. Ultimately, the strategic direction of the asset will depend on the continued success of the ETF segment and the broader stability of the cryptocurrency market.
With several upcoming catalysts expected in the form of regulatory updates and macroeconomic data releases, the longer-term positioning of the token remains a central focus for both retail and institutional portfolios looking for strategic exposure.