
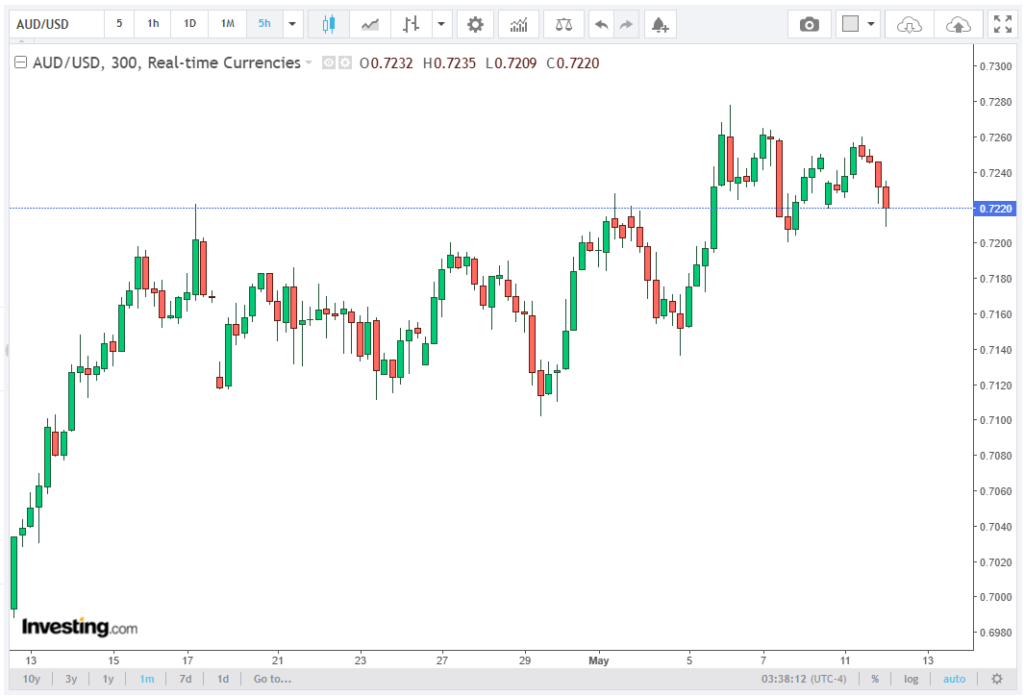
The AUD/USD currency pair has experienced a mixed start this week, following a two-day gain. During the Asian trading hours on Tuesday, the pair traded near 0.7240, reflecting a modest retracement after testing recent highs.
While short-term traders observe minor profit-taking, technical indicators suggest that the broader bullish bias remains intact, with critical support levels ready to absorb downside pressure. The team at Nummixo presents an in-depth analysis of this matter in their recent article.
Technical Overview
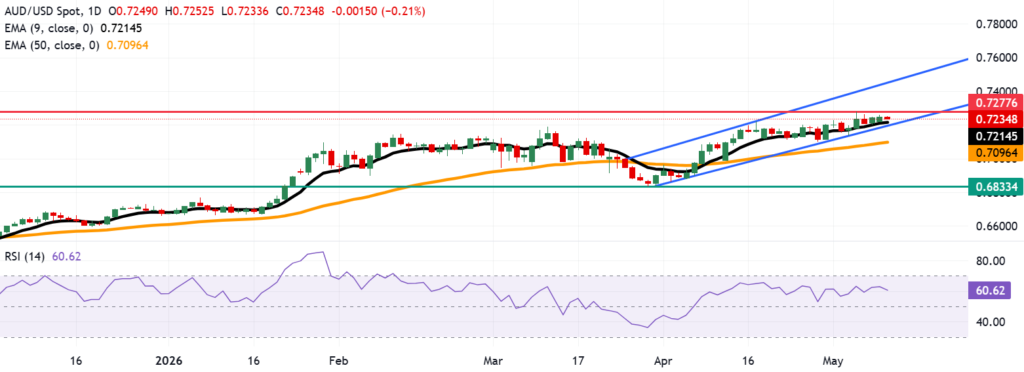
A close inspection of the daily chart indicates that AUD/USD is trading within an ascending channel, hinting at a continuation of its uptrend. The pair remains comfortably above the nine-day and 50-day Exponential Moving Averages (EMAs), which currently provide dynamic support for the ongoing rally.
These moving averages are widely regarded as critical trend indicators that define both short-term and medium-term market direction.
The 14-day Relative Strength Index (RSI), currently positioned around 60, underscores the pair’s resilient bullish momentum. Importantly, the RSI has not reached overbought territory, implying that the pair retains upside potential without signaling an imminent reversal.
Traders often rely on this momentum measure to determine whether buyers remain in control, and a reading above 50 but below 70 typically reflects a market still favoring bullish sentiment.
Near-Term Resistance Levels
On the upside, AUD/USD may revisit the 0.7277 level, marking the highest point since June 2022. This level, recorded on May 6, represents a key resistance area where selling pressure might emerge.
A successful break above 0.7277 would validate the continuation of the bullish trend, potentially paving the way toward the upper boundary of the ascending channel, near 0.7460. Such a breakout would be a significant technical signal for traders aiming to capture gains from further appreciation.
Traders should monitor price action closely around 0.7277, as a failure to breach this level could result in a temporary consolidation or minor pullback. In these scenarios, short-term support levels play an essential role in sustaining market optimism and guiding trading strategies.
Key Support Levels: Nine-Day EMA
The initial support for AUD/USD lies at the nine-day EMA, currently at 0.7214. This short-term moving average acts as a dynamic floor, often absorbing intraday corrections and serving as a reference point for momentum traders. Holding above this level maintains the integrity of the ascending channel, keeping the bullish narrative intact.
A breach below the nine-day EMA would likely direct the pair toward the lower boundary of the ascending channel, near 0.7200. This area is considered critical support, as it represents the intersection of short-term trend dynamics and medium-term price floors. Failure to defend this region could trigger more significant downside pressure, potentially testing the 50-day EMA at 0.7096, a key medium-term trend indicator.
Medium-Term Outlook
While the short-term momentum remains constructive, traders must remain aware of medium-term risk levels. A break below the 50-day EMA would signify a shift in market structure, opening the door for a bearish reversal. In such a scenario, the AUD/USD pair could navigate toward the three-month low of 0.6833, recorded on March 30, marking a significant retracement in the context of the current uptrend.
Conversely, if bullish pressure persists and the pair successfully breaks above 0.7277, the upside potential is amplified. The next technical target would be the upper boundary of the ascending channel around 0.7460, a level that aligns with prior resistance zones and reflects the potential for extended gains. Traders often view these channel boundaries as price targets, allowing for strategically timed entries and exits.
Strategic Implications for Traders
Traders tracking AUD/USD should monitor key support levels: 9-day EMA 0.7214, ascending channel floor 0.7200, and 50-day EMA 0.7096. These may attract buying interest during pullbacks.
On resistance, focus on n recent high of 0.7277 and the channel ceiling of 0.7460. Breaching these levels could signal strong bullish momentum and further upside potential.
Momentum indicators: 14-day RSI 60 suggests controlled but robust buying pressure, supporting potential uptrend continuation.
Staying above moving averages reinforces confidence in long positions, while temporary dips to the 9-day EMA provide low-risk entry points. A decisive break below the 50-day EMA would require risk reassessment, possibly indicating bearish conditions.
Conclusion
The AUD/USD price forecast remains constructively bullish, underpinned by strong technical support and healthy momentum indicators. While minor retracements may occur around 0.7240, the ascending channel structure and sustained levels above nine-day and 50-day EMAs suggest that upside potential remains intact.
Key levels to watch include near-term resistance at 0.7277, short-term support at the nine-day EMA (0.7214), and the critical channel floor at 0.7200. Traders and analysts should also monitor the RSI reading to gauge whether bullish momentum remains under control or begins to show signs of overextension.