
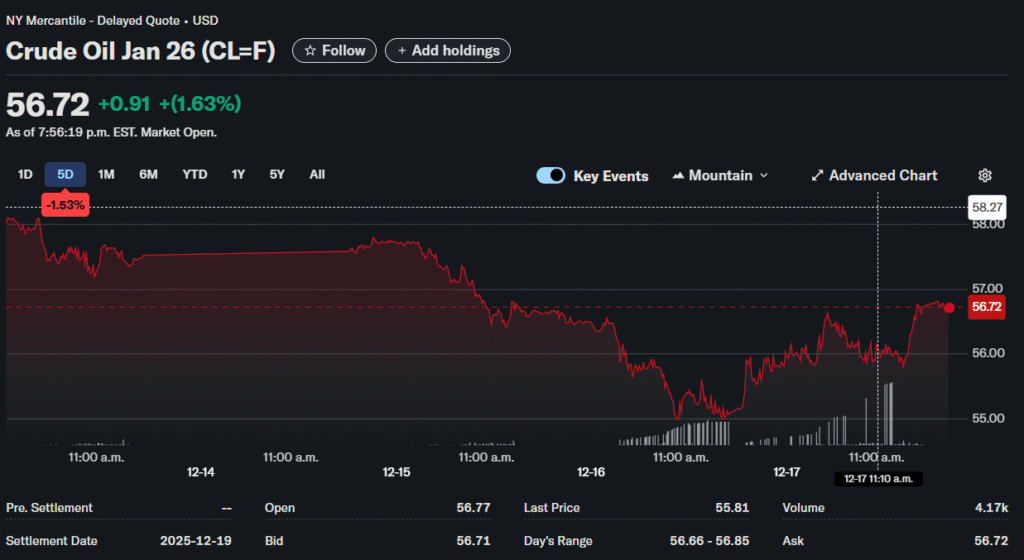
West Texas Intermediate crude tumbled 2.73% on Tuesday, settling at $55.27 per barrel and marking its weakest close since the pandemic lows of February 2021. The global Brent benchmark declined 2.71% to $58.92, with both oil grades hovering around levels not seen in four years, even as geopolitical tensions flare across multiple regions.
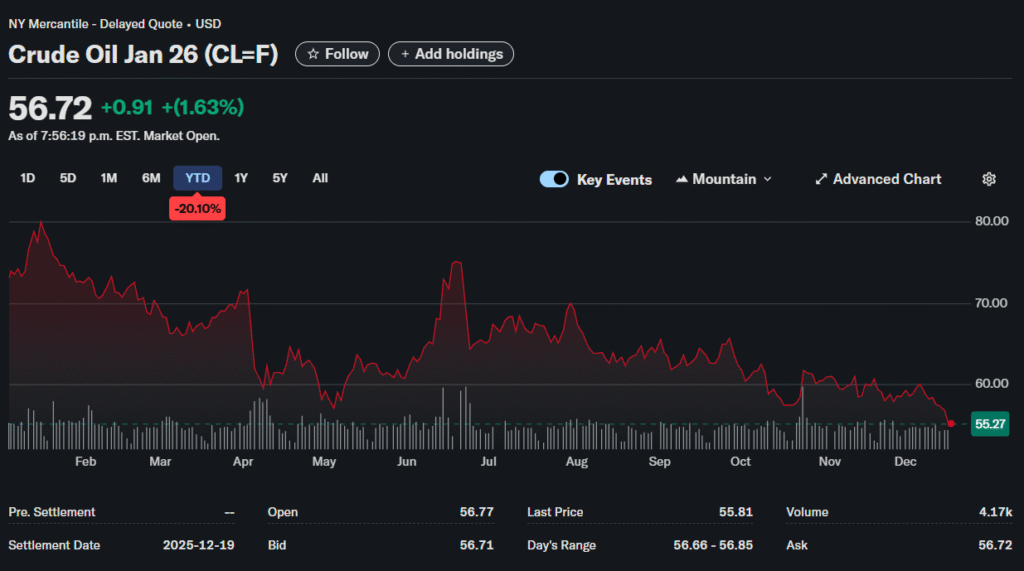
A lead broker at Logirium deep dives into the energy market’s worst annual performance in seven years as oversupply concerns overwhelm geopolitical risk premiums. American crude prices have plunged roughly 23% throughout 2025 in their steepest yearly decline since 2018, while Brent has surrendered approximately 21% of its value for its most devastating annual loss since 2020.
Supply Overwhelms Demand
Global oil supply is set to grow by approximately 3 million barrels per day in 2025 and another 2.4 million bpd in 2026. This expansion comes primarily from non-OPEC producers, including the United States, Brazil, and Guyana. American production has reached record levels despite calls for restraint.
Demand growth tells a different story. The International Energy Agency forecasts consumption will increase by just 830,000 bpd in 2025 and 860,000 bpd in 2026. These figures represent less than one-third of anticipated supply additions.
The math creates a structural surplus exceeding 2 million bpd annually. OPEC+ production cuts have failed to prevent inventory builds. The cartel faces a choice between defending market share and supporting prices through deeper reductions.
OPEC+ Strategy Falters
OPEC+ members have steadily restored previously idled output. The group’s discipline has weakened as members prioritize revenue over price stability. Several countries exceed their production quotas, undermining the coalition’s effectiveness.
Saudi Arabia and other Gulf producers can operate profitably at current price levels. Their low production costs provide a cushion that higher-cost producers lack. This dynamic creates tension within OPEC+ about the appropriate supply management strategy.
Russia continues exporting crude near capacity despite Western sanctions. India and China purchase massive volumes of discounted Russian oil. These flows add to global supply while reducing demand for OPEC barrels.
China Demand Disappoints
Economic data from China point to ongoing weakness in the world’s second-largest economy. Manufacturing activity has decelerated substantially. Industrial production growth rates have slowed to levels that typically indicate recession risk.
China historically drove global oil demand growth through infrastructure spending and industrial expansion. That engine has stalled as the country transitions away from debt-fueled construction booms. Electric vehicle adoption further reduces petroleum consumption.
Refinery run rates in China have declined from peak levels. Independent refiners face margin pressure and reduce throughput accordingly. Crude imports have moderated despite strategic reserve building programs.
Inventory Paradox
Near-record volumes of oil sit on water in tankers globally. This floating storage reflects weak immediate demand and limited onshore capacity. The phenomenon creates downward price pressure despite low inventories at key pricing hubs.
The disconnect between abundant seaborne volumes and tight land-based stocks complicates market analysis. Traders focus on readily deliverable barrels when assessing near-term balance. Oil at sea doesn’t immediately impact physical market tightness.
Forward curves show significant contango, where near-term prices trade below deferred contracts. This structure typically discourages storage and indicates current oversupply. Profitable storage opportunities would exist if the curve steepened further.
Refining Margins Diverge
Product cracks and refining margins reached three-year highs in November despite weak crude prices. Refinery outages combined with impending EU restrictions on Russian product imports tightened availability. This dynamic creates opportunities for integrated producers.
Gasoline and diesel inventories have built up substantially in the United States. The seasonal demand slowdown typically pressures refined product prices during the winter months. Weak consumer spending adds to headwinds for transportation fuel consumption.
Natural gas liquids demand showed recent strength but faces uncertainty. Petrochemical margins have compressed globally. This reduces the incentive to run crackers at high rates, limiting NGL consumption.
Consumer Benefit Emerges
U.S. gasoline prices fell below $3 per gallon nationally for the first time in four years. The decline provides meaningful relief to household budgets ahead of holiday travel. Lower fuel costs boost disposable income for other spending categories.
Heating oil prices have moderated despite approaching peak demand season. Natural gas weakness contributes to broader energy cost deflation. These trends support consumer spending while reducing inflationary pressure.
Airlines benefit substantially from lower jet fuel costs. Operating expenses decline as the largest variable cost component falls. Improved margins could support capacity expansion or fare reductions.
2026 Outlook Darkens
The Energy Information Administration forecasts call for Brent to average near $55 per barrel throughout 2026. This projection assumes OPEC+ maintains its current production policy and demand growth remains subdued.
The global supply surplus could persist for multiple quarters absent major disruptions. Seasonal demand patterns provide limited support given structural oversupply. Markets may require production shut-ins to rebalance.
U.S. shale producers face pressure at current price levels. Higher-cost wells become uneconomic below $60 WTI. Activity reductions would eventually slow non-OPEC supply growth, but with a meaningful lag.