
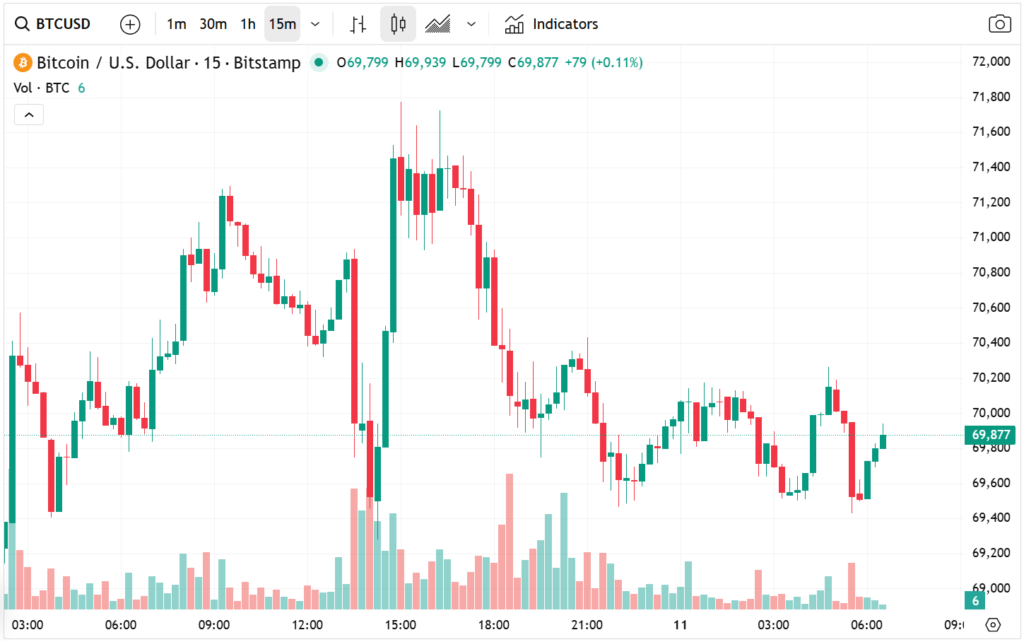
The Bitcoin (BTC/USD) market has recently shown signs of stabilization as the cryptocurrency trades near the psychologically important level of $70,000. As of the latest trading sessions, the BTC/USD pair has been hovering around $69,000, remaining inside a consolidation range that has persisted for roughly the last 30 days.
While this price action signals a degree of stability, Bitcoin still trades significantly below its all-time high of $126,300, leaving room for speculation about the next major directional move. In the article below, the brokers at Byronixel present a complete overview of this topic.
The current sideways price movement suggests that the market may be entering a potential bottoming phase, where selling pressure weakens and buyers begin to gradually accumulate positions. In financial markets, such consolidation periods often precede strong breakout movements, particularly when accompanied by improving technical indicators and stabilizing macroeconomic sentiment.
For traders and investors, the present environment highlights a delicate balance between global macroeconomic risks, geopolitical developments, and technical market dynamics that continue to influence Bitcoin’s price trajectory.
Bitcoin Steady Despite Rising Global Risks
One notable feature of recent market activity is that Bitcoin has remained relatively steady despite rising geopolitical tensions, particularly the ongoing crisis in the Middle East. Historically, geopolitical instability often triggers volatility across global markets, including equities, commodities, and digital assets. However, the BTC/USD pair has demonstrated remarkable resilience in the face of these uncertainties.
A key factor influencing global sentiment has been the sharp movement in energy markets, particularly Brent crude oil prices. On Monday, Brent crude surged to approximately $119 per barrel, reaching one of its highest levels in years amid fears that escalating tensions could disrupt global supply chains. Later in the session, prices pulled back to around $90, reflecting expectations that the situation might stabilize.
BTC/USD Technical Analysis
From a technical analysis perspective, Bitcoin’s price action reveals several encouraging signals that suggest a potential market bottom may be forming.
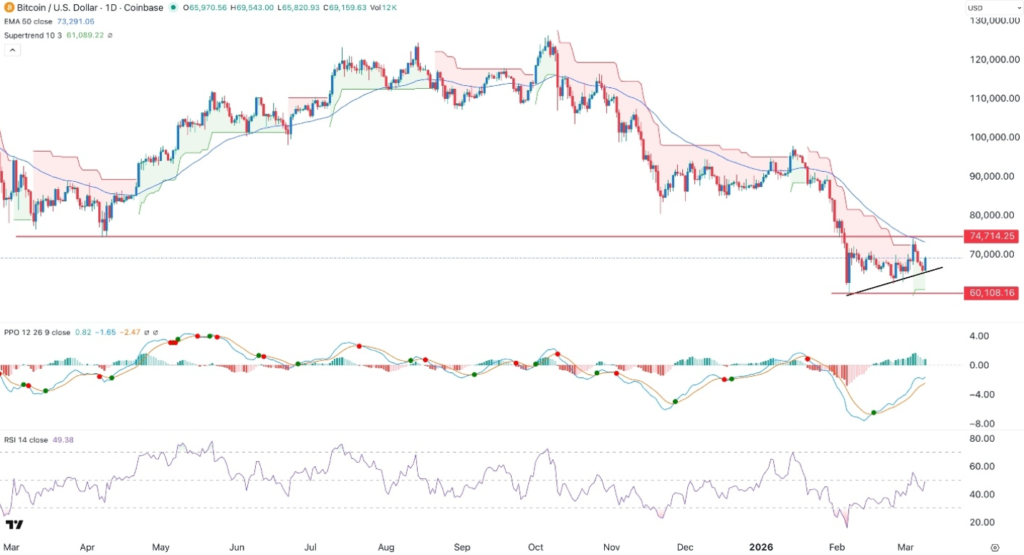
The daily timeframe chart indicates that Bitcoin rebounded from its year-to-date low of $60,100, gradually climbing toward the current $69,000 level. This recovery has been supported by a well-defined ascending trendline, which connects the lowest price swings recorded on February 5 and February 24. The same trendline also acted as support during the March 8 price dip, reinforcing its technical significance.
Maintaining price action above this ascending trendline suggests that buyers are defending key support zones, a common characteristic during early stages of bullish reversals.
Several momentum indicators further support this constructive outlook.
Percentage Price Oscillator (PPO)
The Percentage Price Oscillator (PPO) has continued to rise steadily, moving upward from its year-to-date low and approaching the critical zero line. When the PPO approaches or crosses this level, it typically signals a shift in momentum from bearish to bullish, which traders often interpret as an early trend reversal signal.
Relative Strength Index (RSI)
The Relative Strength Index (RSI) has also shown a significant recovery. After falling to an oversold level near 15, the RSI has rebounded to approximately 50, which represents a neutral momentum zone. Importantly, the indicator is now pointing upward, suggesting growing buying pressure within the market.
Moving Averages and Trend Indicators
Another key technical development is Bitcoin’s attempt to move above the 50-day Exponential Moving Average (EMA). This moving average is widely monitored by traders because it helps determine medium-term market trends. A successful breakout above the 50-day EMA could signal the start of a new bullish phase.
Key Levels to Watch
Based on the current technical structure, the most probable scenario is that Bitcoin continues to move higher in the coming days as market sentiment gradually improves.
The next important resistance level is located near $74,000, which represents a major technical barrier where sellers could re-enter the market.
If bullish momentum strengthens and BTC/USD breaks above this resistance, it could trigger additional buying activity, potentially opening the door for a broader upward move.
However, traders should also remain aware of the downside risks. A break below the key support level at $64,000 would likely invalidate the current bullish outlook, signaling that the recent rebound may have been temporary.
Conclusion
Overall, Bitcoin’s steady performance near $70,000 suggests that the market may be entering a bottoming phase, supported by improving technical indicators and stabilizing investor sentiment. While geopolitical tensions and macroeconomic uncertainties continue to influence global markets, the BTC/USD pair has demonstrated resilience, remaining within a stable trading range.
If momentum indicators continue to strengthen and the price successfully breaks above key resistance levels, Bitcoin could enter a new bullish cycle. For now, traders will closely monitor support at $64,000 and resistance near $74,000, as these levels will likely determine the next major move in the cryptocurrency market.