
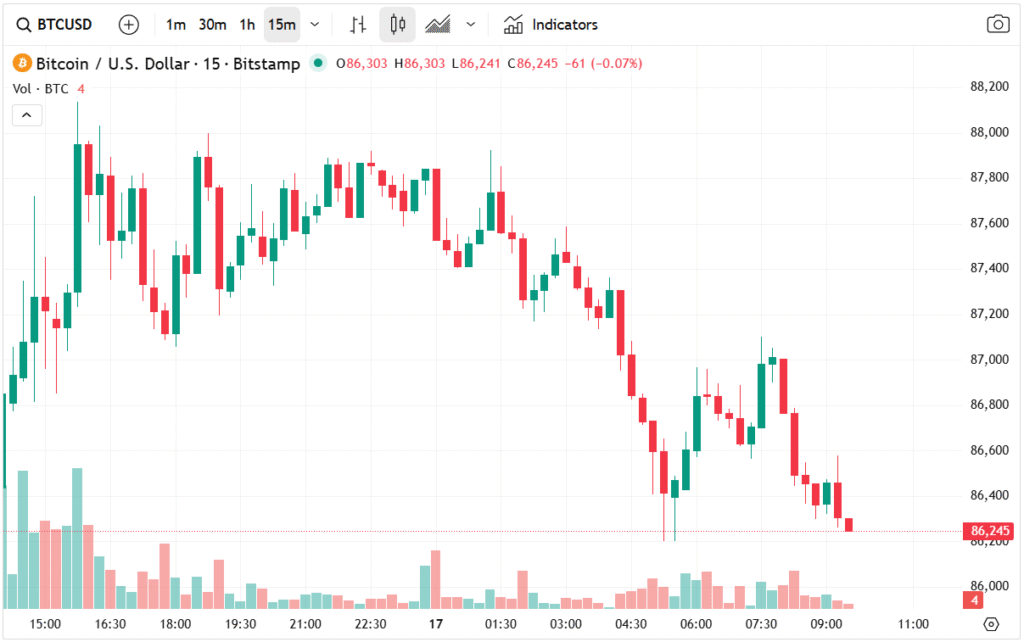
Bitcoin price has remained under pressure, trading slightly below the critical support level at $90,000. The BTC/USD pair was last quoted at $87,630, down from this month’s high of $94,635 and significantly lower than the year-to-date high of $126,130.
The current market dynamics indicate that bears have gained control as demand for Bitcoin shows signs of weakening. The brokers at Tarillium provide a comprehensive breakdown of this topic in this article.
Bitcoin Price Remains on Edge Ahead of BoJ Interest Rate Decision
The BTC/USD pair has faced persistent downward pressure this week amid weak demand. According to SoSoValue data, ETF inflows have weakened, registering outflows for the second consecutive day. This suggests that institutional appetite for Bitcoin has diminished, contributing to increased selling pressure.
Investors are also cautiously awaiting the Bank of Japan (BoJ) interest rate decision scheduled for Friday. Economists widely expect the BoJ to implement a 0.25% rate hike, marking the first increase in eleven months. The rate hike is highly relevant to Bitcoin and other risky assets because historically, investors have leveraged low Japanese interest rates to fund purchases of high-yielding and speculative assets.
With the rise in interest rates and bond yields, market participants may start unwinding these positions, reducing liquidity and putting additional downward pressure on BTC/USD.
Upcoming US Inflation Data Could Influence BTC/USD
Looking ahead, the BTC/USD pair is likely to react strongly to the upcoming US consumer inflation report scheduled for Thursday. Economists anticipate that inflation will remain stubbornly above the Federal Reserve’s 2.0% target, a factor that could influence monetary policy expectations and market sentiment.
Persistent high inflation may reinforce expectations of higher interest rates, creating a challenging environment for risk assets, including cryptocurrencies. Conversely, any signs of cooling inflation could temporarily boost market confidence, providing short-term support for BTC/USD.
On a positive note, energy prices are declining. Brent and West Texas Intermediate (WTI) crude have fallen below the critical $60 support level for the first time in several weeks. Lower energy costs are generally bullish for cryptocurrencies, as reduced inflationary pressures may eventually encourage monetary easing or interest rate cuts, supporting Bitcoin and other digital assets.
Market Sentiment and Trader Behavior
Market sentiment for BTC/USD remains cautious, as investors are hesitant to enter long positions amid ongoing macro uncertainty. The combination of rising interest rates, inflation concerns, and ETF outflows has shifted the risk-reward balance in favor of sellers.
Short-term traders are likely to focus on technical levels, including support at $80,650 and resistance near $90,000, while longer-term investors may adopt a wait-and-see approach until demand stabilizes. This prevailing bearish sentiment underscores the importance of monitoring macro indicators and liquidity flows for potential trend reversals.
BTC/USD Technical Analysis: Downward Trend Intensifies
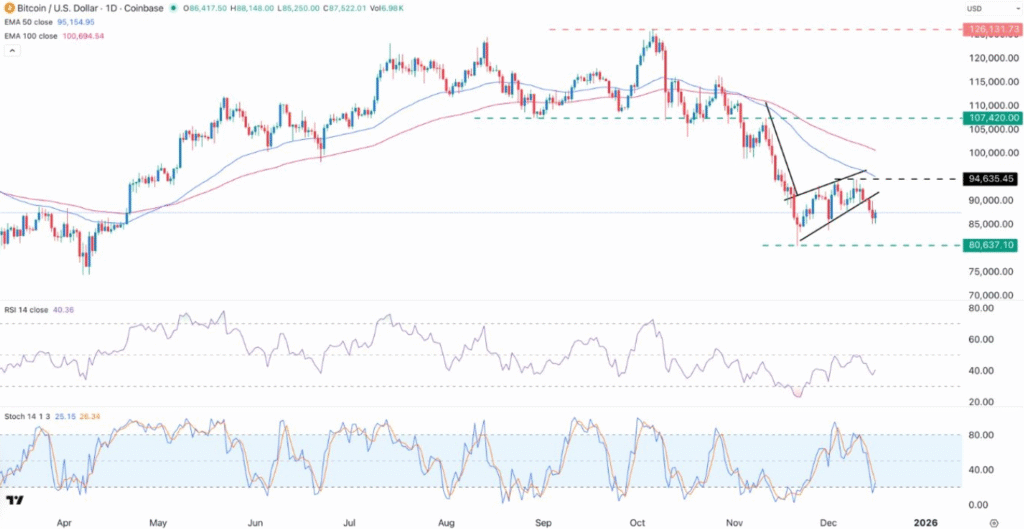
On the daily chart, BTC/USD has been exhibiting a clear downtrend over the past few weeks. The cryptocurrency has fallen significantly, sliding from its year-to-date peak of $126,130 to the present level of $87,400.
Notably, the pair has breached the lower boundary of a bearish flag pattern, a widely recognized continuation signal. Breaching this pattern indicates that selling momentum remains strong and bears are dominating the market.
Additionally, BTC/USD has moved below key Exponential Moving Averages (EMAs), including the 50-day and 100-day EMAs. This is a critical technical signal, suggesting that downtrend momentum is likely to persist in the near term.
The Relative Strength Index (RSI) and the Stochastic Oscillator, two essential momentum indicators, are pointing downwards, further confirming that bearish forces are prevailing. These indicators signal that the BTC/USD pair is entering oversold territory, but the broader trend remains negative.
Key Support and Resistance Levels
Based on technical analysis, the next support level for BTC/USD is projected around $80,650. If this level fails to hold, the pair could see further downside pressure, potentially extending the bearish trend.
On the upside, any recovery attempts may face resistance near $90,000, the previous support turned resistance, followed by $94,635, the monthly high. Traders and investors should closely monitor volume, momentum indicators, and macro events, including BoJ decisions and US inflation data, as these factors could significantly influence price action.
Conclusion
The BTC/USD market is currently dominated by bears, as demand remains under pressure and technical indicators signal further downside potential. Weak ETF inflows, upcoming monetary policy events such as the BoJ rate decision, and persistent inflation concerns are weighing heavily on Bitcoin.
While declining energy prices may offer some bullish support over the medium term, the near-term technical setup suggests that the BTC/USD pair could continue its downward trajectory toward the next support level of $80,650. Traders should stay vigilant, keeping an eye on macro developments and technical signals, as Bitcoin volatility remains elevated.