
Bitcoin (BTC) continues to attract the attention of traders and investors as BTC/USD shows signs of renewed weakness. Following a brief recovery, the cryptocurrency has seen a strong bearish breakdown, losing critical support and signaling potential further declines. In their latest piece, Orbisolyx experts explore the topic in detail for readers.
Bitcoin Drops Ahead of Key Macro Events
The BTC/USD pair has resumed its decline following an early-month rebound, as traders position ahead of major macroeconomic releases. Market participants are closely monitoring upcoming US non-farm payrolls (NFP) data, inflation figures, and the Bank of Japan (BoJ) interest rate decision, all of which are driving increased volatility in the crypto market.
The cryptocurrency fell below the critical support level at $85,000, reaching the lowest price since December 1. Market participants have shown a risk-off sentiment, mirrored in the broader financial markets. For instance, major US stock indices, including the Nasdaq 100 and S&P 500, declined by over 0.50%, reflecting a general aversion to risk assets.
Much of the bearish sentiment stems from expectations that the BoJ may raise interest rates by 0.25% in its upcoming policy meeting. The potential rate hike is aimed at combating rising consumer inflation, which is expected to increase further following the introduction of a new stimulus package in Japan.
Market Sentiment and Investor Behavior
Investor caution has been evident in the crypto market, with the Crypto Fear and Greed Index remaining deep in the fear zone at 28. This sentiment is further reinforced by a decline in futures open interest, which dropped to $130 billion from the October high of $255 billion.
This significant reduction in open interest follows the $20 billion market wipeout on October 10, suggesting that traders are hesitant to take aggressive positions. Falling futures open interest is generally interpreted as a sign of market caution, indicating that investors are remaining on the sidelines amid heightened volatility.
With the upcoming US non-farm payrolls (NFP) data serving as the next key catalyst, market participants are likely to adjust their positions further, potentially increasing BTC/USD volatility in the short term.
Impact of Global Liquidity and Macro Risk
Global liquidity conditions are also contributing to Bitcoin’s bearish trajectory. With central banks, including the Federal Reserve and Bank of Japan, adjusting monetary policy to combat inflation, investors are increasingly cautious about riskier assets like cryptocurrency. Tightening liquidity and potential interest rate hikes reduce the appeal of high-volatility instruments, placing additional downward pressure on BTC/USD.
BTC/USD Technical Analysis
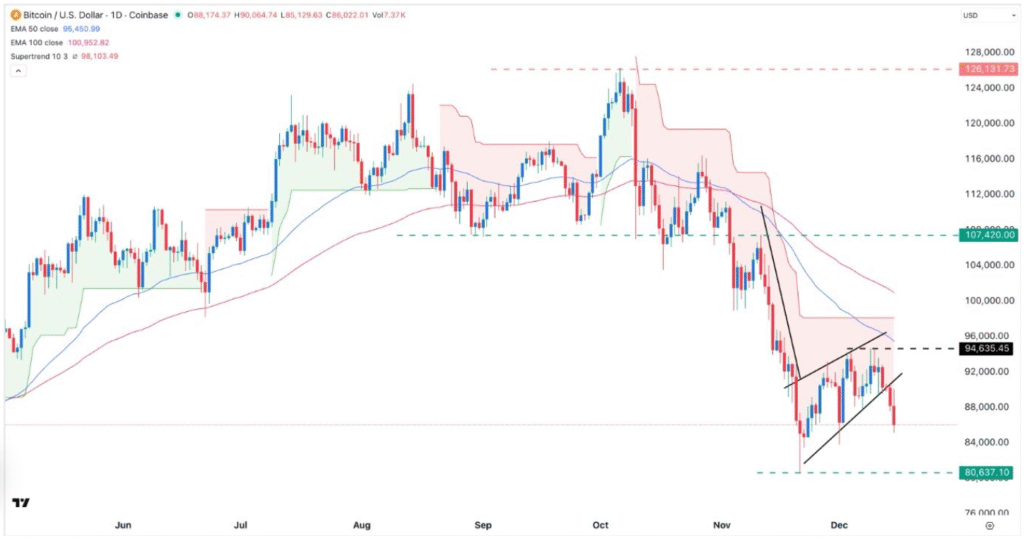
From a technical perspective, Bitcoin has entered a bearish phase. On the daily timeframe, the BTC/USD pair has moved below both the 50-day and 200-day Exponential Moving Averages (EMA), signaling that sellers have taken control of the market.
Additionally, the pair has breached the lower boundary of a bearish flag pattern, widely recognized as a high-risk technical formation that often precedes further downside moves.
This pattern is reinforced by negative signals from other technical indicators. The Supertrend indicator remains in a bearish configuration, the Relative Strength Index (RSI) continues declining, indicating weakening momentum, and the MACD shows persistent downward pressure, confirming the ongoing bearish trend.
These technical signs point to continued downside potential in the BTC/USD pair, with the next key support level at $80,000. A breach of this level could trigger a deeper correction toward the April low of $74,000, extending the bearish momentum in the medium term.
Key Levels and Trading Implications
Traders should monitor several critical levels in the BTC/USD pair, including immediate resistance at $85,000 (previous support), next support around $80,000 (short-term target), and a potential extended downside near $74,000 (April low).
The bearish flag pattern combined with declining EMA levels suggests that selling pressure dominates, and any short-term recovery is likely to be limited. In addition, ongoing market deleveraging and risk-off sentiment in global equities may continue to weigh on BTC.
Investors should also be aware of macro triggers, including US jobs data, inflation reports, and BoJ policy decisions, which can significantly influence volatility and price direction in the short term.
Conclusion
The BTC/USD forex signal points to continued bearish pressure, with a likely move toward the $80,000 support level. Technical indicators, including the bearish flag, RSI, and MACD, reinforce the expectation of further downside. Market sentiment, reflected in the Crypto Fear and Greed Index and declining futures open interest, supports a cautious outlook.
Traders and investors should closely monitor macroeconomic events and key technical levels, as a break below $80,000 could extend Bitcoin’s correction toward $74,000. With both technical and fundamental factors signaling potential declines, the current market environment favors sellers, highlighting the importance of risk management and strategic positioning in volatile conditions.