
The US Dollar Index (DXY), a gauge measuring the strength of the USD against six key foreign currencies, is showing signs of steady confidence, continuing its upward momentum for a second straight session.
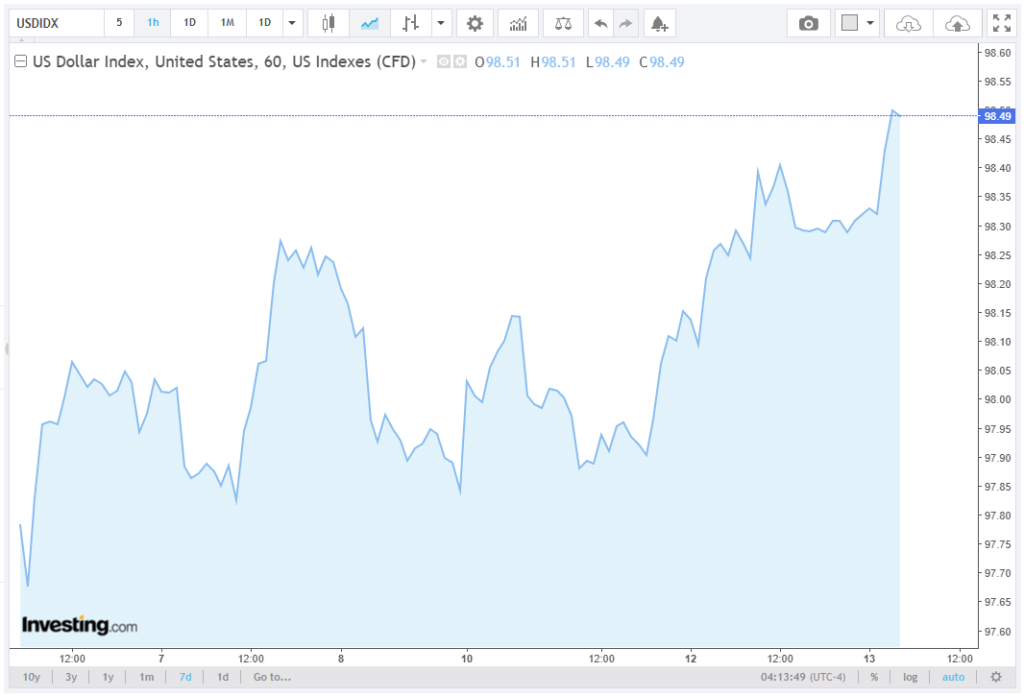
During European trading hours on Wednesday, the index hovers near 98.40, approaching a critical juncture that technical analysts are closely monitoring. Byronixel explores this topic thoroughly in their latest article.
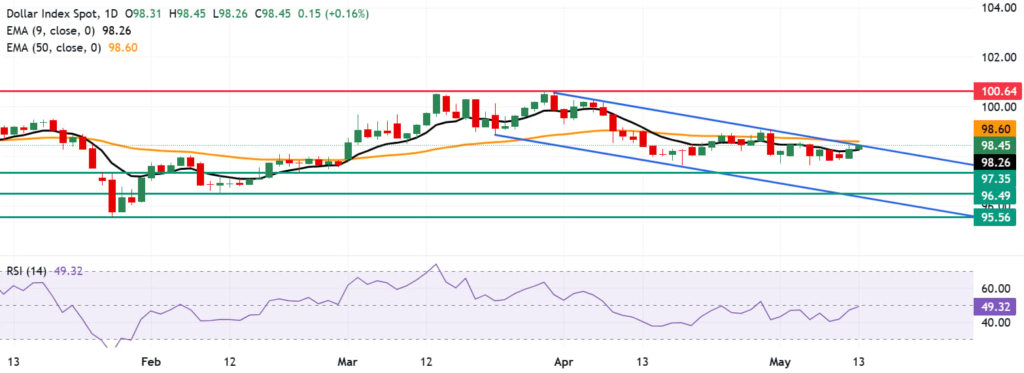
The daily chart analysis indicates that the DXY is currently testing the upper boundary of a descending channel, a key resistance area around 98.50, which may dictate the next directional move for the dollar.
Technical Setup: Descending Channel and Key Moving Averages
The descending channel has been a prominent feature in the DXY’s chart over the past several weeks, with price action contained between clearly defined upper and lower boundaries. The upper boundary of the channel near 98.50 is proving to be a significant resistance, as the index approaches this level for the second day in a row.
A break above this channel could signal a potential bullish reversal, allowing the DXY to target resistance levels above 98.60, including the 50-day Exponential Moving Average (EMA) and further toward the 12-month high of 100.64, recorded on March 31.
On the downside, support levels remain crucial in defining near-term risk. The nine-day EMA at 98.26 currently acts as the first line of defense, containing potential downside pressure. Should this support fail to hold, the 12-week low of 97.35, set on February 23, becomes the next target, followed by the three-month low near 96.49, which coincides with the lower boundary of the descending channel around 96.40.
Momentum Analysis: Relative Strength Index Insights
Momentum indicators provide additional context for the DXY’s price trajectory. The 14-day Relative Strength Index (RSI) currently hovers near 48.9, just below the neutral 50 level. This reading suggests neutral momentum, indicating that the market is not exhibiting strong overbought or oversold conditions.
Such a configuration typically favors a range-bound price action, in line with the DXY oscillating between the short-term nine-day EMA and the longer-term 50-day EMA.
Neutral RSI readings, combined with the descending channel, imply that traders may need to wait for a decisive break above the channel or a breakdown below near-term support before committing to directional bets.
Near-Term Price Action: Resistance and Upside Targets
As the US Dollar Index tests the channel top at 98.50, the immediate focus shifts to the next resistance zones. A clear break above 98.50 would likely attract buyers, positioning the DXY to challenge the 50-day EMA at 98.60 and potentially revisit levels near 100.00, psychological resistance just below last year’s highs.
A sustained move above 100.64, the peak from March 31, could signify a major trend reversal, possibly shifting the broader market sentiment in favor of a stronger dollar.
However, traders must be cautious as the DXY approaches this technical confluence of resistance. The descending channel’s upper boundary, coupled with the neutral RSI, indicates that upward momentum may be moderate and susceptible to reversals, particularly if global macroeconomic developments or central bank policies influence the USD.
Downside Risks: Support Levels and Channel Base
While upside potential exists, downside risk remains significant if the DXY fails to break the channel. The first line of support is the nine-day EMA at 98.26, followed by the 12-week low of 97.35.
A drop below this level could accelerate weakness toward the three-month low of 96.49 and ultimately the channel’s lower boundary near 96.40. Breaching this channel floor would raise the probability of a test of the 95.56 level, marking the lowest point since February 2022.
These support levels are closely watched by technical traders because a sustained breakdown would invalidate the short-term bullish outlook, forcing market participants to reconsider exposure to USD-denominated assets or hedge against further declines. In this context, channel dynamics and EMA positions play a pivotal role in determining both risk management and entry points.
Conclusion: Neutral-to-Mildly Bullish Outlook
Overall, the US Dollar Index remains in a delicate balance, oscillating between near-term support at the nine-day EMA (98.26) and resistance at the descending channel top (98.50). Momentum, as measured by the 14-day RSI near 48.9, remains neutral, indicating that the market has not yet committed to a clear directional bias.
A break above 98.50 could unlock upside potential toward the 50-day EMA and March highs, while a failure to surpass the channel may maintain the range-bound structure and expose downside risks toward 97.35, 96.49, or the channel’s base.
Traders and analysts should closely monitor EMA levels, channel boundaries, and RSI momentum to assess the DXY’s next major move, as the US Dollar remains a central barometer for global currency markets.