
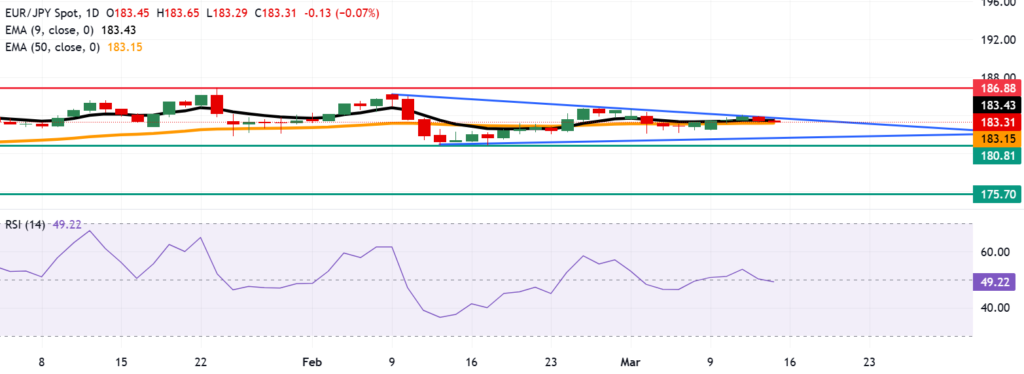
The EUR/JPY currency pair continues to show cautious movements in the Asian session, trading around 183.30 on Friday. Technical analysis of the daily chart suggests that the pair is encountering resistance near the nine-day Exponential Moving Average (EMA), highlighting a period of neutral momentum with a mild bullish tilt. According to the brokers at Nummvix, this article delivers a clear and thorough overview of the topic.
Near-Term Price Action
EUR/JPY has extended its gains for the second consecutive session, signaling that the recent pullback might be stabilizing. The daily chart indicates that the pair is testing the upper boundary of a descending triangle, which often acts as a resistance zone in technical analysis. While a breakout above this boundary could signal renewed bullish momentum, failure to breach it may result in a downside continuation.
Currently, the nine-day EMA, located at 183.43, serves as the immediate barrier. This level is slightly above the spot price, suggesting that while the trend is not firmly established, there remains an upside edge as long as the 50-day EMA, positioned at 183.15, holds as support.
Technical Indicators Suggest Neutral Momentum
The 14-day Relative Strength Index (RSI) hovers near 50, confirming a balanced momentum environment. This indicates that buyers and sellers are evenly matched, with no clear directional bias in the short term. The RSI’s position near the midline reflects a market indecision after the recent pullback from last week’s highs, making the next breakout levels crucial for short-term traders.
Moving averages further underline this neutral stance. The nine-day EMA is currently flattening, demonstrating a lack of strong trend pressure, while the 50-day EMA remains a key support level, providing a foundation for potential upward movement.
Immediate Resistance Levels
For the near term, traders should monitor 183.43, where the nine-day EMA acts as the first resistance level. Beyond this, the upper boundary of the descending triangle, located around 183.70, presents the next significant hurdle. A sustained move above this point could allow EUR/JPY to target the all-time high of 186.88, reached on January 23, potentially attracting momentum-driven traders and increasing volatility in the cross.
It is important to note that these resistance levels are significant in the context of trend continuation patterns. Failure to break through these zones may reinforce the descending triangle, often interpreted as a bearish continuation formation, potentially setting the stage for a short-term correction.
On the downside, EUR/JPY finds initial support near 182.90, corresponding with the recent swing low and a short-term psychological level. A break below this point could open the way toward 182.45, which aligns with the lower boundary of the descending triangle and represents a critical test for bearish momentum.
Traders should watch for a decisive move below this zone, as it may confirm the continuation of the downtrend and increase the likelihood of a retest of 181.80, the next key support.
Key Support Levels
On the downside, immediate support is located at the 50-day EMA of 183.15, which serves as a critical pivot for medium-term momentum. A break below this level could expose the lower boundary of the descending triangle, near 181.80, increasing the probability of a further correction toward the three-month low of 180.81, recorded on February 12.
A more extended bearish move could see EUR/JPY testing the four-month low of 175.70, noted on November 5, which would confirm a loss of medium-term momentum and mark a significant technical reversal in the pair. Traders should monitor these support zones closely, as breaches could trigger stop-loss orders and accelerate downward moves.
Technical Summary
The technical summary indicates a near-term bias that is neutral with a mild bullish tilt. Immediate resistance is seen at the nine-day EMA of 183.43 and the upper boundary of the descending triangle at 183.70.
On the downside, key support levels include the 50-day EMA at 183.15, the descending triangle lower boundary at 181.80, a three-month low of 180.81, and a four-month low at 175.70. The momentum indicator, with the 14-day RSI near 50, signals balanced momentum, suggesting neither strong buying nor selling pressure.
The current technical landscape suggests that EUR/JPY is in a consolidation phase. While short-term bullish opportunities exist if the nine-day EMA is breached, the pair remains constrained within the descending triangle pattern.
Traders should therefore focus on key moving averages and support/resistance levels, combining them with the RSI to gauge potential breakouts or reversals.
Conclusion
EUR/JPY’s price action indicates a cautious market sentiment, with resistance near 183.43 providing a critical test of strength. The 50-day EMA support at 183.15 will likely determine whether the pair maintains its upside potential or resumes a downward trajectory.