
The EUR/USD pair extended its losses for the second consecutive day, trading around 1.1760 during the Asian session on Tuesday. Despite the minor decline, the pair remains within an ascending channel pattern, suggesting that the overall bullish bias continues to dominate in the short-term outlook.
Technical indicators indicate that the pair is consolidating near key support levels, while the upside momentum remains constructive. The consultants at Marbrisse outline an extensive breakdown of this subject in this piece.
Current Technical Overview
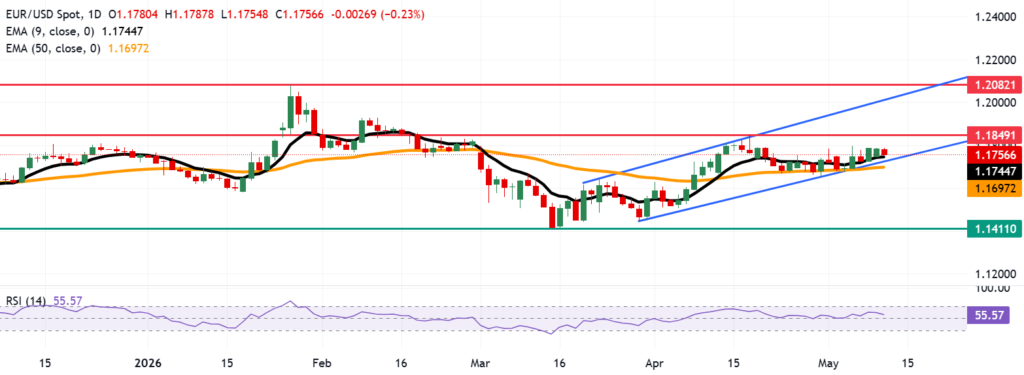
From a daily chart perspective, EUR/USD is holding above both the nine-period and 50-period Exponential Moving Averages (EMAs). The nine-day EMA, currently at 1.1744, is serving as the immediate support level. Meanwhile, the 50-day EMA, positioned around 1.1697, provides an additional buffer in case of a deeper retracement. The short-term EMA is trending above the longer-term EMA, reinforcing the mild bullish bias.
The 14-day Relative Strength Index (RSI) stands at 56, indicating that the pair maintains constructive upside momentum. The RSI is well below the overbought zone, suggesting there is still room for upward moves without significant risk of immediate reversal. Traders often use the combination of EMA levels and RSI readings to gauge potential entry and exit points, which in this case points to a cautious but positive outlook for EUR/USD.
Immediate Support and Resistance Levels
On the downside, EUR/USD faces immediate support at the nine-day EMA of 1.1744. A breach of this level could open the path toward the lower boundary of the ascending channel, currently around 1.1730, followed by the 50-day EMA at 1.1697.
Traders should also monitor the nine-month low at 1.1411, recorded in mid-March, as a significant longer-term support level that could act as a major reversal zone if the pair experiences sustained downside pressure.
On the upside, the first major resistance barrier is the 12-week high of 1.1849, which the pair reached on April 17. A sustained break above this level would likely push EUR/USD toward the upper boundary of the ascending channel, near 1.2020. Beyond the channel, the next notable resistance exists around 1.2082, the highest level since June 2021, achieved in late January.
Short-Term Outlook
In the short-term, the pair appears to be testing a mild consolidation phase near the nine-day EMA. The continued presence above key EMAs combined with a moderate RSI reading indicates that the bullish bias remains intact, even as the pair experiences temporary downward pressure. Traders should watch for a decisive break below 1.1744, which could signal the start of a deeper retracement toward the 50-day EMA.
Conversely, a rebound off the nine-day EMA could enable the pair to retest 1.1849, and potentially challenge the ascending channel’s upper limit. Such a move would confirm that EUR/USD retains its upward trajectory, maintaining the bullish technical structure despite short-term corrections.
Key Technical Indicators
Key Technical Indicators provide traders with insight into the near-term behavior of EUR/USD. The nine-day EMA at 1.1744 acts as an immediate support, while the 50-day EMA at 1.1697 offers secondary support. On the upside, the 12-week high at 1.1849 represents primary resistance.
Momentum indicators also offer valuable guidance. The 14-day RSI, currently at 56, signals constructive upside momentum, suggesting that buying pressure may persist. Additionally, the lower ascending channel boundary at 1.1730 serves as support, whereas the upper ascending channel boundary at 1.2020 provides resistance.
Significantly, the all-time high since June 2021 at 1.2082 marks a major resistance level that traders will closely monitor. Overall, the combination of EMA levels and RSI readings continues to serve as a reliable guide for assessing near-term bias. The ascending channel pattern further confirms that, even amid minor pullbacks, EUR/USD retains potential for upside gains.
Conclusion
Overall, the EUR/USD pair is navigating a delicate phase of minor consolidation near the nine-day EMA at 1.1744, while retaining a bullish bias within the ascending channel. Short-term traders should closely monitor the 12-week high of 1.1849 for potential upside breakout signals. On the downside, key support levels, including the nine-day EMA, 50-day EMA, and lower channel boundary, are likely to define the pair’s immediate trading range.
While temporary declines may continue toward the 1.1750 region, the 14-day RSI at 56 and the positioning above critical EMAs suggest that upside momentum remains intact. Investors and traders can expect EUR/USD to oscillate within these technical boundaries, with the potential for a decisive move once either support or resistance levels are decisively breached.
Overall, the technical landscape indicates that despite the minor pullback, EUR/USD remains on a cautiously bullish path. The interplay between support at the nine-day EMA and resistance at the 12-week high is likely to define trading decisions in the coming sessions, providing a clear framework for market participants.