
The GBP/USD pair has experienced a noticeable decline, slipping to near 1.3570 during the European trading session on Tuesday. This movement reflects a risk-off sentiment in global markets, fueled by renewed US-Iran tensions, which have enhanced the safe-haven appeal of the US Dollar (USD). The brokers at Marbrisse deliver an all-encompassing breakdown of this subject in this piece.
As investors assess the potential implications of geopolitical unrest, the British Pound (GBP) continues to face pressure, particularly around the critical 61.8% Fibonacci retracement near 1.3600, a level that remains a significant barrier for GBP bulls.
Market Drivers: Geopolitics and Data
Sources suggest that the US President is now considering a resumption of major combat operations, heightening market uncertainty. Consequently, major risk assets are under pressure, with S&P 500 futures trading around 0.2% lower at approximately 7,395, while the US Dollar Index (DXY) strengthens by 0.25%, approaching 98.15.
On the economic calendar, investors are closely watching two key releases. First, the US Consumer Price Index (CPI) for April is expected at 12:30 GMT, with forecasts projecting an acceleration in headline inflation to 3.7% Year-on-Year (YoY), up from 3.3% in March.
This report is likely to impact USD dynamics and influence the near-term direction of GBP/USD. In the UK, the preliminary Q1 Gross Domestic Product (GDP) report is anticipated on Thursday, with estimates suggesting an increase of 0.6% versus the prior 0.1%, potentially providing support for the British Pound.
GBP/USD Technical Analysis
Technically, GBP/USD is trading at 1.3570, reflecting a modest decline of 0.3% in early European trade. Despite this pullback, the pair retains a bullish bias, as it continues to hold above the 20-day exponential moving average (EMA) at 1.3534, as well as the 50% Fibonacci retracement of the latest downswing at 1.3520.
The Relative Strength Index (RSI) currently hovers around 54, signaling mildly positive momentum. This suggests that buyers may attempt to push the price higher, provided it remains above these key support levels. Maintaining a foothold above the 20-day EMA and the 50% Fibonacci retracement is crucial for sustaining upward momentum in the Cable.
Resistance Levels and the Key 61.8% Fibonacci Barrier
The immediate resistance for GBP/USD lies at the 61.8% Fibonacci retracement near 1.3604, a level that has repeatedly challenged British Pound bulls. A successful breach above this barrier could open the path toward the 78.6% retracement around 1.3723 and potentially the recent swing high near 1.3874, corresponding with the 100% retracement of the recent downswing.
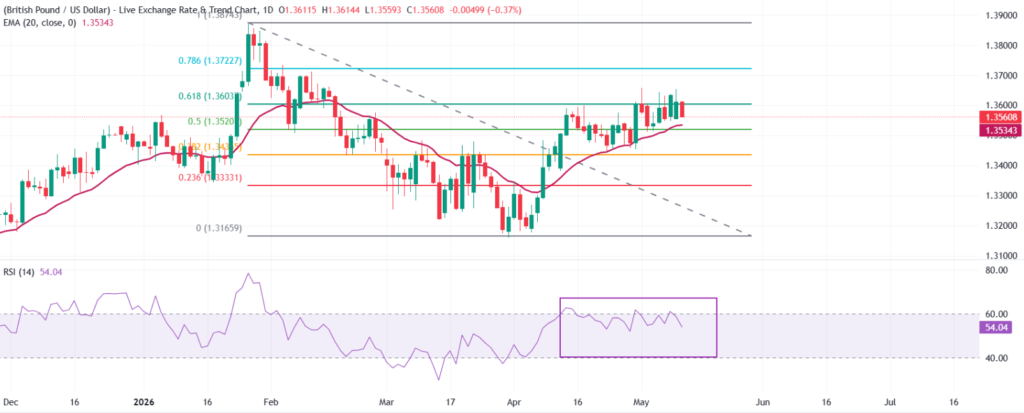
The 61.8% Fibonacci level is a critical technical pivot often watched by traders as it represents a significant retracement threshold. Historically, price action around this zone tends to encounter strong selling pressure, making it a key battleground between buyers and sellers. As such, the GBP/USD pair may face further consolidation or pullback if upside momentum remains limited.
Support Levels and Downside Risks
On the downside, a break below the 20-day EMA at 1.3534 would expose the 50% retracement at 1.3520, followed by additional support near the 38.2% level at 1.3437. A further decline could target the 23.6% retracement at 1.3333, with the 0% anchor at 1.3166 serving as a major structural floor. These levels provide a roadmap for traders to manage risk and plan entry or exit strategies in response to market volatility.
The current price action suggests that while GBP/USD is under pressure, the overall technical structure remains supportive for buyers, particularly as the pair retains its position above the key moving averages. Traders are likely to monitor how the price behaves near the 1.3600 barrier, with momentum indicators and Fibonacci retracements guiding potential reversal or continuation patterns.
Market Outlook
Looking ahead, GBP/USD remains sensitive to both geopolitical risks and economic data releases. The US CPI and UK Q1 GDP reports are expected to generate volatility, influencing the pair’s short-term trajectory. Meanwhile, the 61.8% Fibonacci retracement near 1.3600 is likely to continue acting as a key resistance level, shaping the interaction between bulls and bears.
In summary, the GBP/USD pair is navigating a complex landscape where technical levels, fundamental drivers, and market sentiment intersect. While bullish momentum exists above the 20-day EMA and 50% Fibonacci retracement, sustained upside requires a decisive break above 1.3600, which remains a critical barrier. Conversely, failure to clear this hurdle could result in renewed selling pressure, potentially exposing deeper support levels at 1.3520, 1.3437, and 1.3333.
Investors and traders should remain alert to geopolitical developments, monitor inflation metrics, and carefully watch technical zones, particularly the 61.8% Fibonacci retracement, which continues to define the GBP/USD trading range in the near term.