
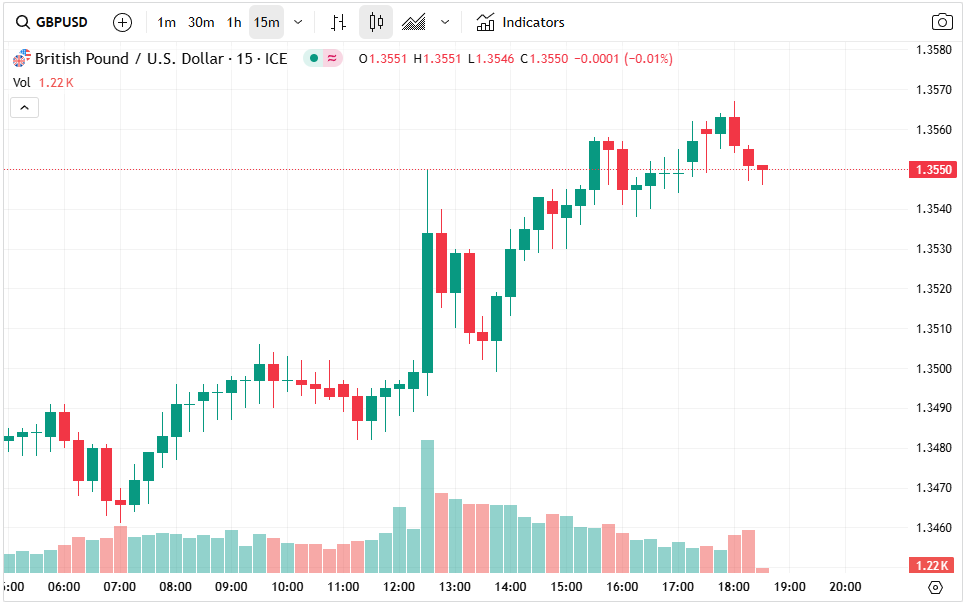
The GBP/USD currency pair is showing signs of technical weakness just ahead of a high-impact fundamental release: the US inflation data. After peaking at a year-to-date high of 1.3615, the pair has pulled back to the psychological level of 1.3500, a key support zone watched by traders.
This retreat coincides with the release of UK labor market data and the market’s anticipation of upcoming US CPI numbers, adding both technical and fundamental pressure to the pair. Servelius brokers offer an in-depth analysis of this subject here.
UK Jobs Data Adds Caution to the Bullish Narrative
On Tuesday, the Office for National Statistics (ONS) reported that the UK unemployment rate rose slightly to 4.6% in April, reflecting some loosening in the UK labor market. In addition, the UK economy added just 89,000 jobs, while average earnings growth slowed from 5.5% to 5.2%.
This deceleration in wage growth indicates that the UK labor market may be cooling, potentially reducing inflationary pressures and weakening the case for tighter monetary policy from the Bank of England (BoE).
Although job creation remains positive, the moderation in wage inflation and the uptick in unemployment suggest that the UK economic recovery may be softening. These signals are particularly important for FX traders, as they hint at possible shifts in interest rate differentials, which are key drivers of currency pair movements like GBP/USD.
US Inflation Report in Focus
Attention now turns to the US Consumer Price Index (CPI) data, set to be released on Wednesday, which is expected to significantly influence Federal Reserve policy expectations and consequently, the US dollar. Analysts forecast that headline CPI rose by 0.2% month-over-month (MoM), bringing the annual rate from 2.3% to 2.5%.
Meanwhile, core CPI is projected to rise by 0.3% MoM, lifting the annual rate from 2.8% to 2.9%.
This uptick in inflation is thought to be partially driven by price adjustments following tariffs introduced by the US President, and could fuel expectations that inflation will remain elevated throughout 2025. If confirmed, these figures might challenge the Fed’s dovish stance, especially as the central bank has already cut interest rates by 0.25% earlier this year.
Any sign of accelerating inflation could reduce the odds of further rate cuts in the near term, supporting the US dollar (USD) and putting additional downward pressure on the British pound (GBP).
GBP/USD Technical Outlook: Wedge Pattern Flags Reversal Risk
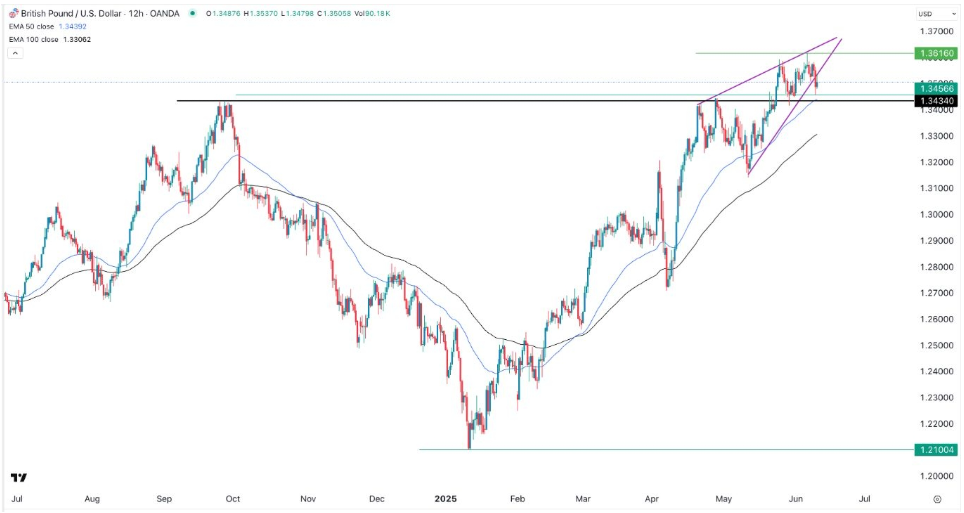
From a technical analysis perspective, the GBP/USD chart is flashing caution signals. On the 12-hour timeframe, the pair has been in a robust uptrend, rallying from around 1.2100 in January to 1.3615, representing a 12.54% increase. This sustained momentum was validated by a breakout above 1.3435, which marked the upper boundary of a cup-and-handle pattern, a classic bullish continuation formation.
However, recent price action suggests a potential reversal is underway. The pair has developed a rising wedge pattern, characterized by converging ascending trendlines. This structure is widely regarded as a bearish reversal signal, often indicating a loss of bullish momentum and a likely shift to the downside.
If this pattern plays out as expected, the next major support level to watch is 1.3400, a psychological area that aligns with prior consolidation zones. A sustained drop below this level could signal a deeper retracement or even a broader trend reversal.
Conversely, a break above 1.3615, the current 2025 high, would invalidate the wedge pattern and reassert the bullish trend, opening the door toward 1.3700 and beyond.
Trading Outlook
In summary, the GBP/USD pair is delicately balanced between bullish macro trends and bearish technical formations. The development of a rising wedge pattern suggests caution for buyers, particularly with the UK economic data showing signs of moderation. Meanwhile, the upcoming US CPI print is likely to provide the catalyst for the next major move.
Traders and analysts should prepare for increased price swings, especially around the 1.3400–1.3615 range, with close attention to fundamental drivers, interest rate expectations, and inflation dynamics in both economies. The interplay between these variables will determine whether GBP/USD breaks down from its wedge pattern or resumes its upward march in defiance of the bearish signal.
For now, all eyes are on Wednesday’s US inflation data, which could be the deciding factor in the next directional phase for GBP/USD.