
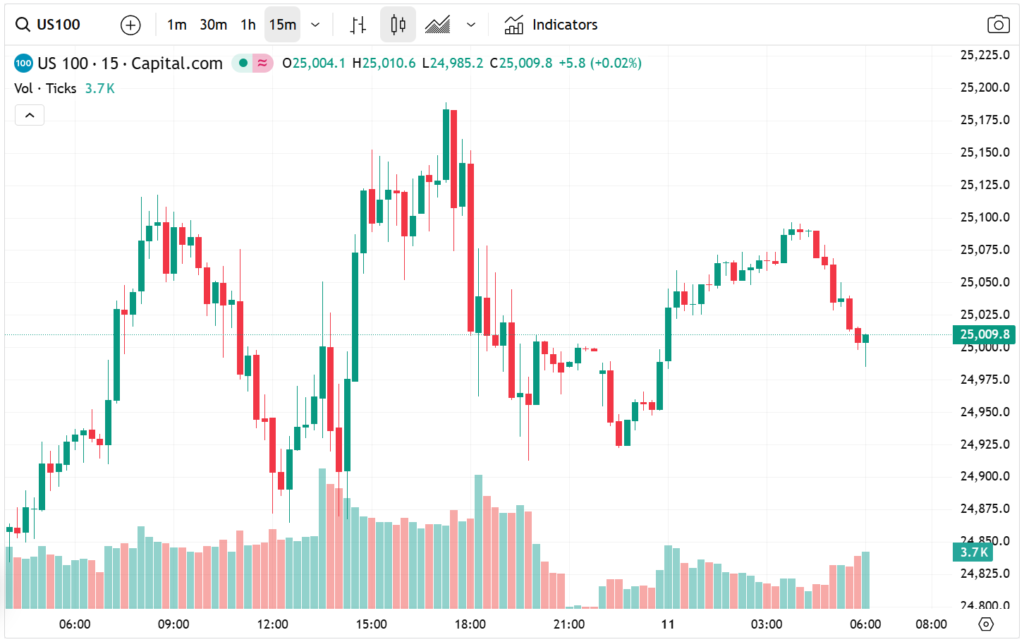
The NASDAQ 100 started the week with significant volatility, falling sharply during Asian and European trading sessions before staging a notable recovery once the New York session opened. This type of price action has become increasingly common in recent months, where early-session weakness is followed by renewed buying pressure from U.S. investors. In this article, the brokers at Byronixel offer a detailed explanation of this topic.
Despite the earlier bearish sentiment, the market demonstrated once again that the U.S. equity market remains highly resilient. Traders initially reacted to global uncertainty and mixed macroeconomic signals by pushing the index lower, but the return of risk appetite during the American session quickly reversed those losses.
This pattern highlights an important dynamic within the current market environment: while there are plenty of fundamental reasons to expect downside, the underlying demand for technology stocks continues to support the NASDAQ 100.
Break Below the 200-Day EMA and Rapid Recovery
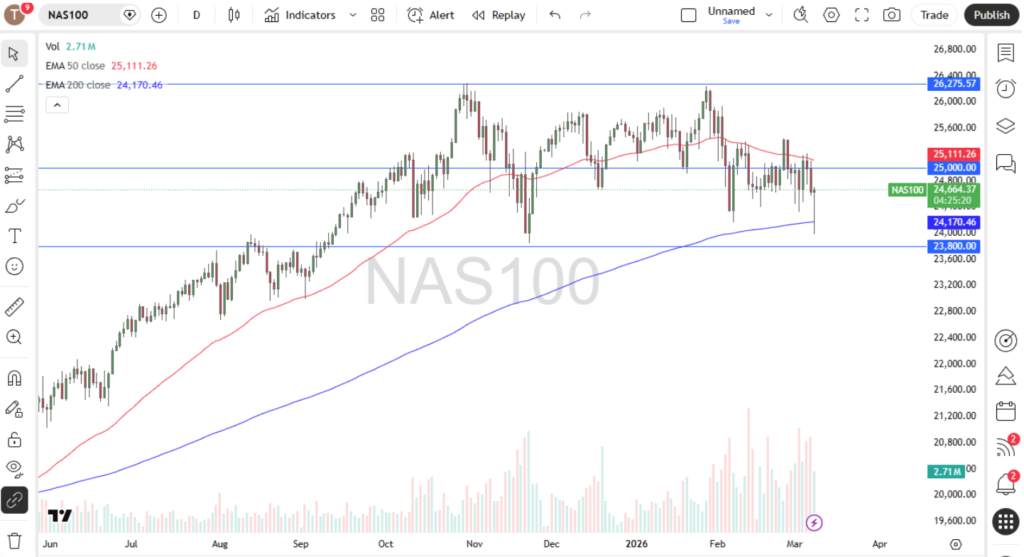
One of the most notable technical developments during Monday’s session was the temporary breakdown below the 200-day Exponential Moving Average (EMA). The 200-day EMA is widely regarded as one of the most important long-term technical indicators used by institutional traders and portfolio managers.
During the early part of the session, the NASDAQ 100 briefly slipped beneath this critical support level, triggering concerns that the market might be preparing for a deeper corrective move. In many cases, such a break would encourage momentum traders and short sellers to increase their positions.
However, the market quickly reversed course, with buyers stepping in aggressively once U.S. markets opened. This rapid rebound suggests that the 200-day EMA is still being respected as a major support zone.
Resilience of the U.S. Stock Market
The resilience of the U.S. stock market has become one of the defining features of the current market cycle. Over the past several months, traders have been confronted with numerous macroeconomic uncertainties, including geopolitical tensions, interest-rate concerns, and global economic slowdown fears.
Under normal circumstances, these factors might have triggered a prolonged bear market phase. Instead, the NASDAQ 100 continues to hold within a broad consolidation range, suggesting that investors remain willing to buy dips rather than sell rallies.
This behavior is particularly significant because the technology sector often leads broader market sentiment. When major tech indices remain stable or recover quickly from declines, it often signals that risk sentiment across global markets remains intact.
The 25,000 Level: Gateway to Higher Prices
Looking ahead, one of the most important resistance levels on the chart is the 25,000 level. This psychological and technical barrier has become a focal point for traders assessing the next major move in the NASDAQ 100.
If the index can successfully break above 25,000, it could open the door for a significant bullish expansion phase. Such a breakout would likely attract momentum traders, algorithmic strategies, and institutional capital, potentially accelerating the upward move.
In this scenario, the next key target would likely be the 25,500 level, which represents a natural intermediate resistance zone based on recent price structure.
Beyond that, the 26,275 level emerges as a potential longer-term upside objective. A move toward this region would confirm that the NASDAQ 100 has fully resumed its broader bullish trend, which has dominated the market for much of the past decade.
Downside Risk and Key Support Levels
While the bullish scenario remains plausible, traders must also consider the possibility of downside risk. Markets rarely move in a straight line, and periods of consolidation often involve false breakouts and sharp pullbacks.
The most critical support level to monitor is the 23,800 region. If sellers manage to push the NASDAQ 100 below this level, it could trigger a more significant corrective decline.
A break beneath 23,800 would likely attract short-selling activity, potentially accelerating downside momentum. In that case, traders might begin targeting deeper support zones as the market searches for a new equilibrium.
Outlook: Trading Range with Bullish Bias
Overall, the NASDAQ 100 remains locked within a broad trading range, but the underlying structure still suggests a bullish bias. The ability of the market to recover quickly from intraday sell-offs indicates that buyers continue to dominate key support zones.
If the index manages to reclaim and hold above 25,000, it would significantly strengthen the case for a new upward leg in the longer-term trend.
Until that breakout occurs, traders should expect continued volatility and consolidation, particularly as markets react to economic data releases, geopolitical developments, and central-bank expectations.
Nevertheless, the repeated defense of major support levels, including the 200-day EMA, reinforces the idea that the NASDAQ 100 remains structurally strong, and any positive catalyst could quickly push the market toward new highs.