
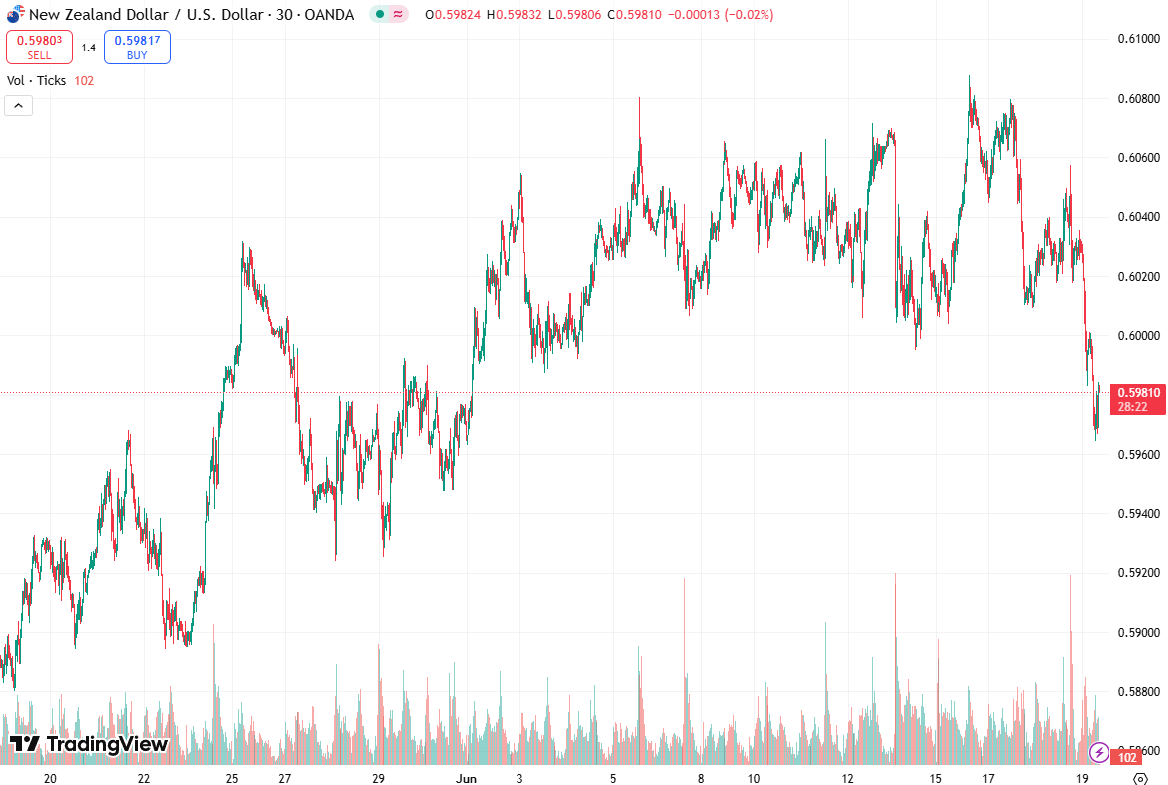
The NZD/USD currency pair is showing signs of renewed bearish pressure as the pair trades around 0.5970, following a nearly 1% decline on Thursday. The move comes amid a clear technical breakdown, with the pair falling below the ascending channel that has been intact for several weeks.
This development introduces a bearish bias in the near term and places key support zones, especially the 50-day Exponential Moving Average (EMA) near 0.5943, into focus. Fletrade’s latest article by Oscar Holstein walks you through the key elements of this topic with expert insight.
Break of Ascending Channel Signals Technical Weakness
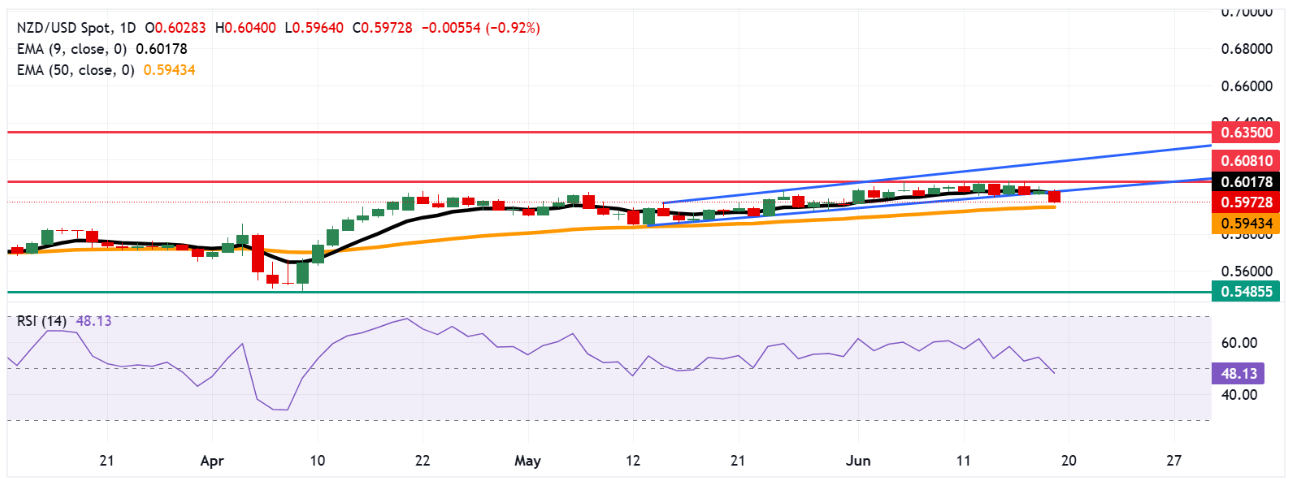
From a technical analysis perspective, the NZD/USD daily chart reveals a decisive break below the ascending channel, which served as a supportive structure since early May. The loss of this upward channel suggests that the recent bullish momentum has stalled, and market sentiment is starting to shift to the downside.
The pair is also trading beneath its nine-day EMA, currently located at 0.6017, underscoring a short-term bearish momentum. The inability to maintain levels above this fast-moving average reflects growing pressure from sellers. This bearish confirmation is further supported by the Relative Strength Index (RSI), which remains below the 50 level, indicating weakening price strength.
50-Day EMA as Crucial Near-Term Support
As the NZD/USD continues to drift lower, immediate attention turns to the 50-day EMA, now situated at approximately 0.5943. This level not only marks a significant technical support area but also aligns closely with the psychological threshold of 0.5950. A sustained break below this zone would likely invite further selling pressure.
Should the bears gain control and force a decisive move below the 0.5943 support, the next potential downside target would emerge near 0.5485, representing the lowest level since March 2020. Such a move would indicate a shift in the medium-term trend, pushing the pair into a broader corrective phase.
Bearish Indicators Reinforce Downward Bias
In addition to price action and trendline dynamics, several technical indicators are reinforcing the bearish tone:
- The nine-day EMA is sloping downward, reflecting short-term bearishness.
- The 14-day RSI remains below the neutral 50 level, currently showing values in the low 40s, confirming a lack of bullish strength.
- The pair is trading below both short-term and medium-term averages, increasing the probability of an extended downtrend.
This confluence of bearish signals suggests that traders should be cautious about long positions unless the pair exhibits a clear reversal or successfully reclaims broken technical levels.
Upside Recovery Scenarios and Resistance Zones
Despite the prevailing bearish outlook, there remains the possibility of a recovery bounce. The first hurdle in such a scenario would be a retest of the broken ascending channel. A successful reentry into the channel structure would be the first sign of stabilization, especially if NZD/USD manages to climb back above the nine-day EMA at 0.6017.
Further resistance lies at the recent eight-month high of 0.6081, achieved on June 5. A breakout above this high would be a bullish milestone, potentially invalidating the current downtrend and reviving investor confidence.
Should this happen, the pair could look to test the upper boundary of the ascending channel, projected around the psychological level of 0.6200.
Beyond this, the next key resistance is at the nine-month high of 0.6350, registered in October 2024. However, such a bullish scenario would require not only strong momentum but also supportive macroeconomic fundamentals, something currently lacking in the short term.
Market Sentiment and Broader Implications
The bearish tilt in NZD/USD can be partially attributed to macroeconomic dynamics and shifting expectations for interest rate policy in both New Zealand and the United States. The U.S. dollar strength remains a key driver, bolstered by hawkish Federal Reserve commentary and relatively strong U.S. data, including labor market resilience and sticky inflation figures.
Conversely, the New Zealand dollar has struggled amid subdued economic data and cautious Reserve Bank of New Zealand (RBNZ) policy tones. This divergence in monetary policy outlooks places further downside pressure on the NZD/USD cross, reinforcing the technical outlook discussed.
Conclusion
In the near term, a daily close below 0.5943 could open the door for an extended bearish move. Conversely, a recovery above 0.6017 would be the first signal that the pair might attempt a fresh rally. Until such developments occur, the bias remains cautiously bearish, with momentum indicators favoring sellers.