
Solana (SOL) is on the move today, capturing the attention of traders and investors alike as the token broke past the $90 threshold. This level has acted as resistance for months, and a move above it appears to be triggering a significant short squeeze. The brokers at Rubizio break down the complexities of this topic in a clear and detailed article.
SOL Short Liquidations Exceed Bitcoin
Trading activity surged alongside the price move, with volumes spiking to nearly $5 billion, representing approximately 9% of Solana’s circulating market cap. Yet, the true story lies not only in trading volume but in short liquidations.
According to CoinGlass data, over $21 million worth of SOL shorts were liquidated in the past 24 hours. This is notable because it surpasses Bitcoin’s $16 million in short liquidations over the same period, a rare occurrence that underscores the intensity of the move. Solana’s 4.5% price increase today is largely isolated from the broader crypto market, signaling that SOL is benefiting from strong technical momentum rather than overall market trends.
This spike in short liquidations confirms that $90 is a key resistance level, one that could determine the next leg of the rally.
Solana ETFs Post Strong Inflows
Another significant development is seen in Solana-linked ETFs, which have experienced four consecutive days of net inflows. On May 6, these ETFs brought in $21 million, marking the largest single-day inflow since January 14.
Rising ETF demand suggests that investors are increasingly embracing altcoins beyond Bitcoin (BTC) and Ethereum (ETH). This could signal a broader shift in market sentiment toward high-potential projects like SOL.
Meanwhile, macroeconomic conditions remain unstable, with the U.S. Federal Reserve undergoing a leadership transition. Kevin Warsh is set to replace Jerome Powell, and the market is closely monitoring how monetary policy may change under his guidance.
The Crypto Fear and Greed Index currently stands at 48 (Neutral), reflecting cautious investor sentiment. Despite this neutrality, SOL’s breakout may signal early bullish positioning.
Declining DEX Volumes Highlight DeFi Weakness
While SOL is surging, decentralized exchange (DEX) volumes remain in a downtrend, highlighting lingering weakness in DeFi activity. On-chain data shows April marking the third consecutive month of declining DEX volumes, and the trend extends into May.
Using a simple run-rate calculation from the first eight days of May, DEX volumes could total $37.5 billion, an 11% decline from April. This suggests that, while SOL rallies, overall DeFi trading activity and meme coin engagement remain muted.
Historical Patterns Signal Upside for SOL
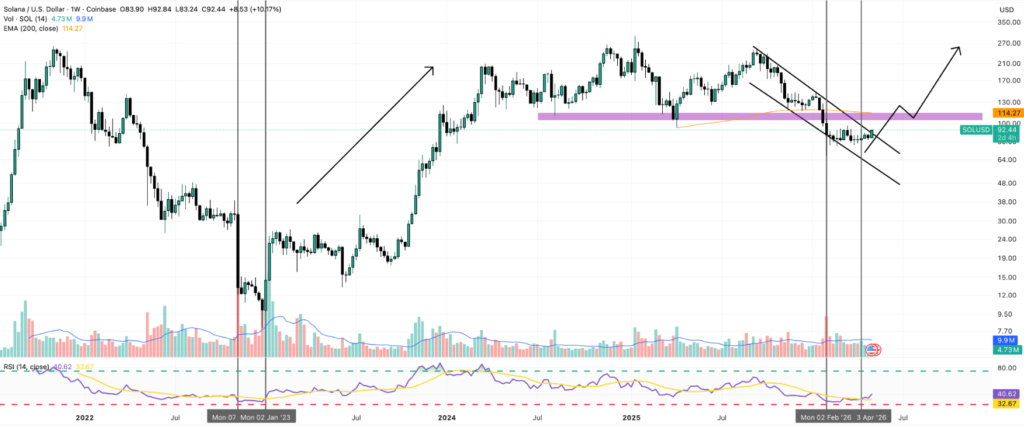
From a technical perspective, the weekly chart offers an encouraging outlook. The Relative Strength Index (RSI) recently dropped below 30, the first occurrence since December 2022. Historically, such levels have preceded massive rallies for Solana.
In the previous cycle, SOL surged from $9 to $200, generating an astounding 2,122% return over 15 months. While replication is not guaranteed, this historical pattern indicates potential for significant upside.
Additionally, the RSI has crossed above the 14-week moving average, echoing the early stages of the previous rally. A sustained move above $90 could push SOL out of its descending channel and target $110, aligning with the 200-week exponential moving average (EMA), a critical technical indicator. Breaking this level would enhance the probability of a rally toward $200.
Technical Outlook: Daily Chart Considerations
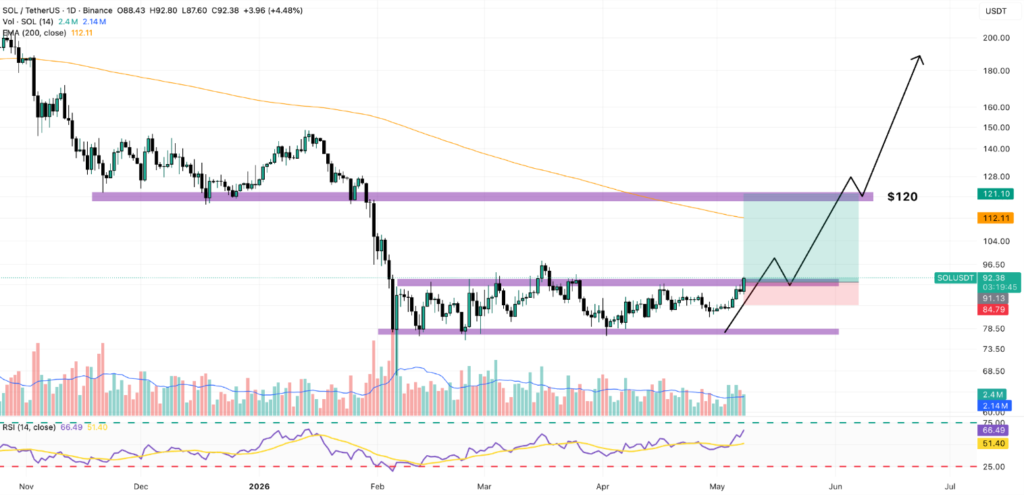
On the daily chart, SOL’s breakout above $90 invalidates a long-standing bearish flag pattern and escapes a consolidation zone. The next key resistance zones appear at $110 and $120, with the first corresponding to the 200-day EMA and the second to a prior demand zone.
The daily RSI has reached 66, the highest since January, signaling strong bullish momentum. While the breakout is promising, a retest of $90 may offer a strategic entry point for traders, with a suggested stop-loss near $84, yielding a 4.7x risk-reward ratio.
Intraday and Short-Term Signals: 4-Hour Chart
Intraday signals reinforce the bullish thesis. The 4-hour chart has delivered four consecutive buy signals, the latest following SOL’s breakout above $90. Volume support indicates participation from whales and institutions, reinforcing the high-conviction nature of this trade.
The RSI in the 4-hour chart sits at 71, suggesting robust momentum, while the daily chart signals hint at the potential for further appreciation, provided the $96 resistance level does not trigger a significant pullback.
Conclusion
Solana’s $90 breakout has triggered record short liquidations, surpassing Bitcoin, and is reinforced by strong ETF inflows. Historical trends and RSI-based buy signals suggest substantial upside potential over the next 12 to 15 months.
While DEX activity and macro uncertainty pose some caution, the technical landscape is compelling. Traders should monitor $110 and $120 resistance levels, while those seeking risk-adjusted entries may find opportunities near $90.
In summary, SOL is demonstrating strong momentum, institutional support, and historical bullish patterns, positioning it as a high-interest altcoin for both traders and long-term investors alike.