
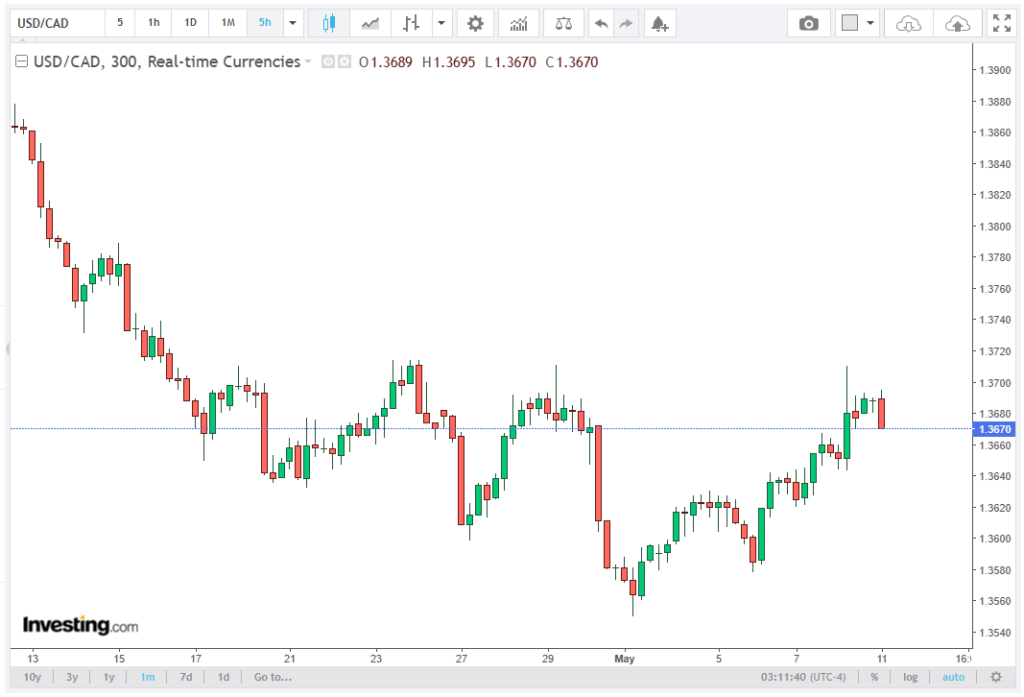
The USD/CAD currency pair is trading on a flat note near 1.3675 in early European trading on Monday. Market participants remain cautious as the pair continues to hover below the 100-day Exponential Moving Average (EMA), a critical technical resistance level that often signals the broader trend for this North American cross.
Despite a minor rebound from last week’s lows, the bearish bias remains intact, and key levels of support and resistance are likely to dictate the near-term trajectory. Readers can find a complete breakdown of this topic from the brokers at Winseterra in this article.
Fundamental Drivers: US Jobs Data and Oil Prices
The recent performance of the USD/CAD pair is being influenced by a combination of US economic data and commodity market dynamics. On Friday, the Bureau of Labor Statistics (BLS) reported that the US economy added 115,000 jobs in April. This result fell short of March’s revised 185,000 increase but significantly exceeded market expectations of 62,000. Meanwhile, the Unemployment Rate remained steady at 4.3%, consistent with consensus forecasts.
This nonfarm payroll (NFP) report offers mixed signals for the US Dollar (USD). On one hand, the stronger-than-expected payroll growth supports the USD, suggesting resilience in the US labor market. On the other hand, the slowdown relative to March highlights a moderation in job creation, which may temper expectations of aggressive Federal Reserve rate hikes in the near term.
At the same time, the Canadian Dollar (CAD) is benefiting from rising crude oil prices. The recent geopolitical developments in the Middle East have intensified concerns over energy supply disruptions. Israeli Prime Minister Benjamin Netanyahu warned that the conflict with Iran “is not over,” which has heightened risk premiums on crude oil.
Canada, as a major oil-exporting nation, typically sees its currency strengthen when oil prices rise, providing a counterbalance to the USD’s support from US economic data.
Technical Analysis: Bearish Bias Persists Below 100-Day EMA
From a technical perspective, USD/CAD remains below the 100-day EMA, a crucial trend-defining level. This placement signals that the overall sentiment is still mildly bearish, even after the modest bounce from last week’s lows.
On the daily chart, the pair is trading just above the 20-day Bollinger middle band, indicating a tentative attempt to stabilize. The Relative Strength Index (RSI), hovering around 48, suggests that momentum is broadly neutral, reinforcing the likelihood of consolidation rather than a strong directional move in the short term.
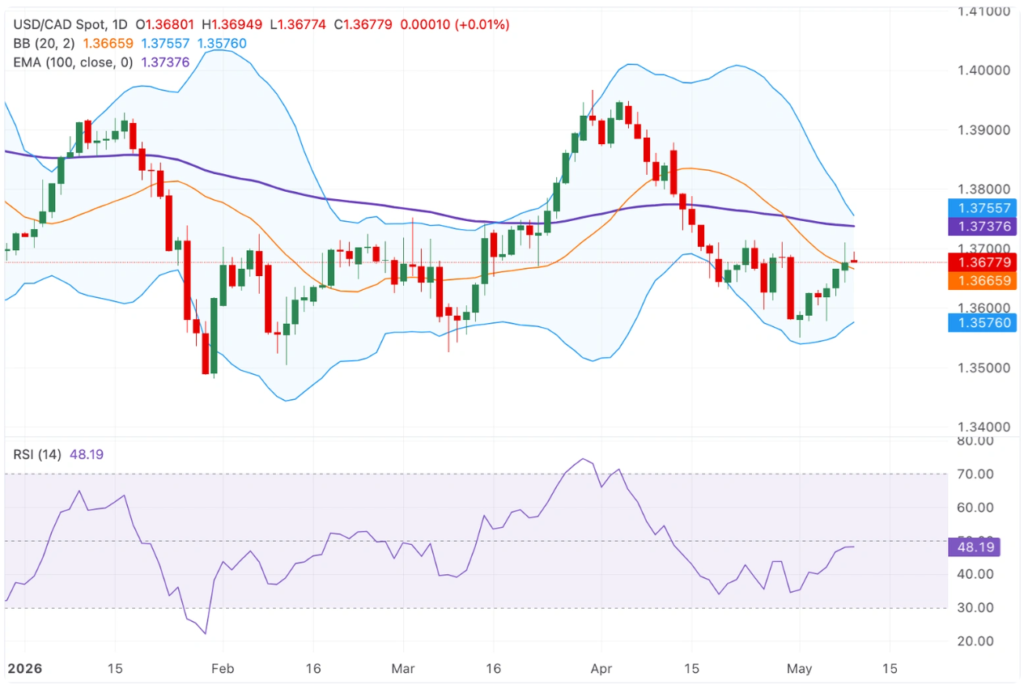
Immediate resistance is marked by the 100-day EMA at 1.3738, which coincides with the upper Bollinger band near 1.3756, forming a near-term supply zone. A decisive break above this resistance would be required to shift the short-term bias to the bullish side.
On the downside, immediate support is identified at the 20-day Bollinger middle band at 1.3665. Should this level fail to hold, the lower Bollinger band near 1.3575 becomes the next target, potentially reopening a path for a deeper corrective slide.
Key Levels to Watch
Monitoring the following price levels is crucial for traders and analysts: immediate resistance is at 1.3738 (100-day EMA), while secondary resistance lies at 1.3756 (upper Bollinger band). On the downside, immediate support is at 1.3665 (20-day Bollinger middle band) and secondary support at 1.3575 (lower Bollinger band).
Remaining below the 100-day EMA reinforces a bearish sentiment, whereas a sustained break above 1.3738 would indicate potential short-term bullish momentum.
Market Outlook: Consolidation Likely
Given the current market dynamics, USD/CAD is expected to trade in a narrow range between 1.3665 and 1.3738 in the near term. The flat price action reflects a balance between US dollar support from stronger-than-expected NFP data and Canadian dollar strength from higher crude oil prices and geopolitical risk premiums.
Traders should watch for breakouts from this range to confirm the next directional bias. A sustained move above 1.3738 could challenge the broader bearish trend, while a breakdown below 1.3665 may signal a renewed downside correction toward the lower Bollinger band.
In addition, market participants should remain alert to economic releases, oil price movements, and geopolitical developments, as these factors can quickly alter risk sentiment and impact the USD/CAD trajectory.
Conclusion
In summary, USD/CAD continues to trade flat near 1.3675, constrained below the key 100-day EMA. The pair faces resistance at 1.3738 and support at 1.3665, with the broader technical picture pointing to consolidation rather than decisive trend shifts. US labor market strength supports the USD, while rising crude prices underpin the CAD, creating a delicate balance in the near term.
Traders and analysts should closely monitor price action around the 100-day EMA and key Bollinger bands to gauge potential breakouts or corrections, keeping in mind the influence of geopolitical tensions and oil market developments on this commodity-linked currency pair.