
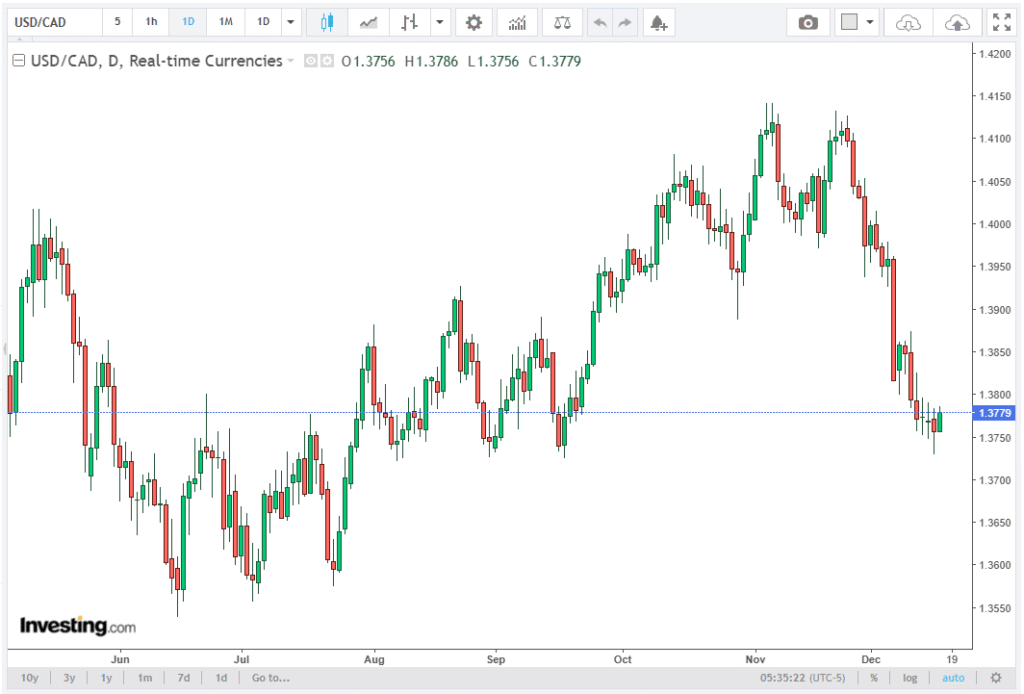
The USD/CAD currency pair is showing signs of potential technical recovery after modest losses in the previous session. During European trading hours on Wednesday, the pair is hovering around 1.3780, testing key resistance levels while remaining under pressure from short-term moving averages.
In their latest publication, Tarillium experts explore the core elements of the subject in depth. Market participants are closely monitoring the pair as it approaches the upper boundary of a descending wedge, a bullish reversal pattern that could signal a potential upside breakout.
Technical Setup
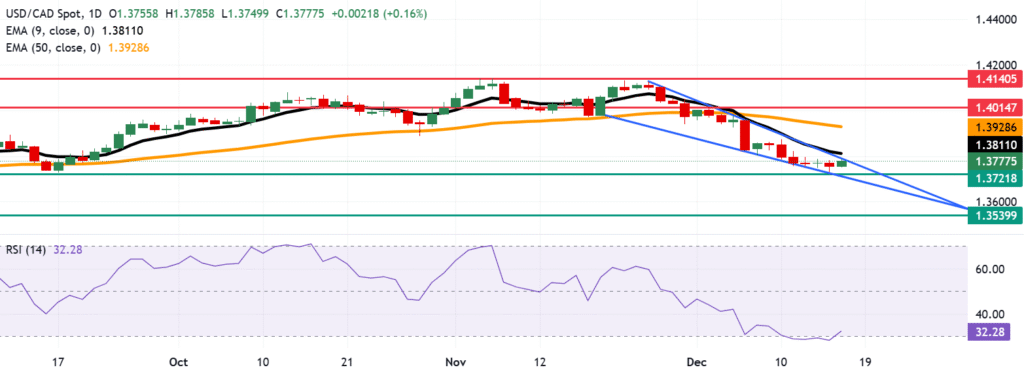
The daily chart indicates that USD/CAD is forming a falling, converging trendline structure, characteristic of a descending wedge. This pattern often precedes a trend reversal, suggesting that a break above the wedge’s upper boundary could pave the way for further upside momentum.
Despite this, the pair remains under the nine-day Exponential Moving Average (EMA) and the 50-day EMA, reflecting a continued bearish bias. The short-term average is still positioned below the 50-day EMA, indicating that sellers continue to dominate the market.
Moving averages are sloping downward, and price action remains capped by the nine-day EMA, reinforcing a persistent downtrend. A successful recovery above the short-term EMA could trigger a corrective bounce, but the 14-day Relative Strength Index (RSI) at 33, though rebounding from oversold levels, remains below its midline, limiting upside potential.
Support Levels
USD/CAD finds its primary support at the four-month low of 1.3721, marking a critical level for short-term traders. Should the pair breach this level, the next support lies at the lower boundary of the descending wedge near 1.3710, followed by the psychological level of 1.3700.
A break below 1.3700 would open the door for a more significant downward move, potentially targeting the October 2024 low at 1.3539. Traders will closely monitor these levels as key risk points, especially given the pair’s position near the oversold region on the RSI.
Resistance Levels
On the upside, USD/CAD is testing the upper boundary of the descending wedge at approximately 1.3790, followed closely by the psychological barrier at 1.3800. This level coincides with the nine-day EMA at 1.3811, forming a confluence resistance zone that could challenge bullish momentum.
A decisive break above this zone would likely trigger a rebound, with the 50-day EMA at 1.3928 as the next target. Beyond this, the pair could aim for the three-week high of 1.4014, signaling a potential trend reversal after months of bearish pressure.
RSI and Momentum Analysis
The 14-day RSI at 33 provides insight into the pair’s momentum dynamics. Although the RSI has rebounded from oversold levels, it remains below the 50-level midline, highlighting the limited upside momentum in the short term. Traders should watch for a move above 50, which would indicate a strengthening bullish trend and confirm a potential breakout from the descending wedge.
The combination of oversold conditions and proximity to the upper wedge boundary makes the current setup technically significant. Should USD/CAD fail to clear the 1.3800 barrier, sellers may regain control, maintaining pressure toward support levels around 1.3721 and 1.3700.
Moving Averages Outlook
The pair’s position relative to key moving averages adds further context to the forecast. The nine-day EMA is currently capping price action, and a break above could spark a short-term rally.
The 50-day EMA, positioned at 1.3928, represents a key medium-term resistance. The downward slope of both averages confirms the persistent bearish trend, but a wedge breakout could potentially disrupt the downtrend.
Short-Term Forecast
In the short term, USD/CAD appears poised for a cautious upside move toward 1.3800, contingent on a successful breach of the upper descending wedge boundary. Failure to overcome this confluence resistance zone may see the pair revert to support at 1.3721 or lower.
Traders should monitor price action, RSI behavior, and EMA interactions to assess the likelihood of a trend reversal. A sustained move above 1.3800 and the nine-day EMA could propel the pair toward the 50-day EMA at 1.3928, with subsequent targets around 1.4014. Conversely, weakness below 1.3721 could extend bearish pressure toward 1.3700 and 1.3539.
Conclusion
USD/CAD is at a technical crossroads, testing the upper boundary of a descending wedge near 1.3790–1.3800 while remaining under critical moving averages. Key support levels at 1.3721, 1.3710, and 1.3700 will be essential in determining whether the pair continues its downtrend or embarks on a corrective rebound.
Market participants should focus on EMA positions, RSI momentum, and the descending wedge breakout as indicators of short-term and medium-term price direction. A successful breach above the 1.3800–1.3811 zone could shift the market’s sentiment from bearish to neutral or bullish, with potential targets extending to 1.3928 and 1.4014.