
Silver (XAG/USD) retreated on Thursday after surging to an all-time high on Wednesday, giving back a portion of the gains. The white metal currently trades around the $65.75-$65.70 region, down over 1% for the day, reflecting the influence of short-term profit-taking.
Despite the minor pullback, the broader technical outlook remains bullish, with market participants eyeing potential dip-buying opportunities at lower levels. This article by Servelius offers expert commentary and a complete breakdown of the topic.
Silver Pullback: Profit-Taking Triggers Near-Term Slide
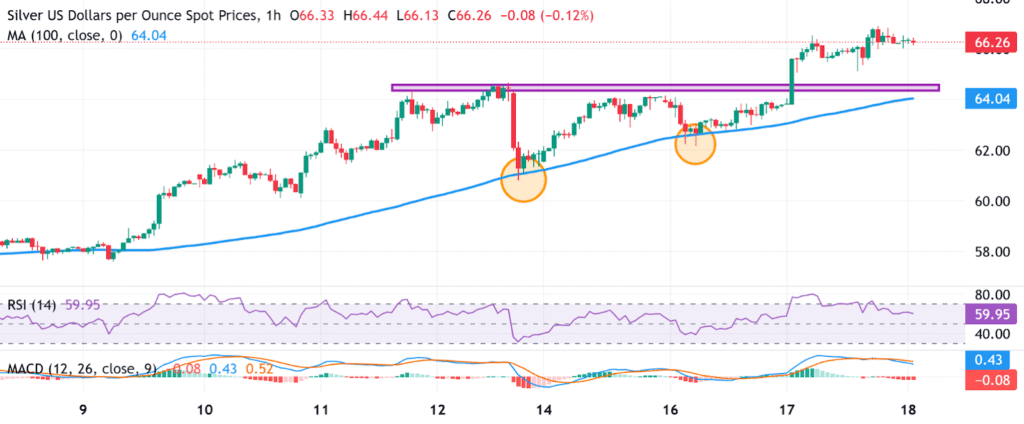
The recent retreat in silver prices can largely be attributed to an overbought Relative Strength Index (RSI) on the daily chart. The RSI, a momentum indicator, had signaled overextension following the meteoric rise to the all-time peak, prompting traders to lock in profits. On the 1-hour chart, the RSI stands at 59.95, showing a neutral-to-bullish stance, yet the daily overbought condition indicates that short-term corrections are likely.
Alongside the RSI, the Moving Average Convergence Divergence (MACD) also indicates slowing momentum. The MACD histogram fell below zero, showing the MACD line crossed under the Signal line, pointing to a temporary pause in upward momentum. While this signals caution for bulls, the overall trend remains constructive.
Key Technical Levels: Support and Resistance in Focus
The overnight breakout above the $64.00 horizontal barrier was pivotal in confirming a near-term bullish outlook. This level now aligns closely with the 100-hour Simple Moving Average (SMA), which acts as a critical support zone for short-term traders. The upward slope of the 100-hour SMA indicates that any corrective pullback is more likely to attract dip-buying, rather than triggering a deeper decline.
Resistance levels are clearly defined near the all-time peak above $66.00, which continues to attract sellers. A decisive break above the $66.00 mark could reignite bullish momentum and target higher levels, while failure to reclaim this threshold could lead to further sideways consolidation.
Momentum Indicators: Gauging Bullish and Bearish Pressure
Technical indicators currently offer a mixed picture for XAG/USD. The RSI is neutral-to-bullish on the 1-hour chart but overbought on the daily timeframe, indicating potential for minor retracements without derailing the broader uptrend.
The MACD histogram below zero signals a temporary loss of momentum, while a return above zero would confirm renewed bullish strength. The 100-hour SMA, with its rising slope, provides dynamic support, making dips attractive for traders looking to enter at lower levels.
The combination of these technical tools suggests that short-term profit-taking may persist, but the longer-term trend remains favorable for bulls, especially if XAG/USD maintains above the 100-hour SMA.
Bullish Technical Setup: Dip-Buying Opportunities
Despite the current pullback, the broader technical framework continues to favor bullish traders. Any retreat toward the 100-hour SMA or $64.00 support zone is likely to attract buyers seeking to capitalize on the ongoing uptrend. Traders are closely watching the interaction between price and moving averages, as a sustained bounce off these levels could resume the push toward previous all-time highs.
A deeper pullback could occur if there is a break below the 100-hour SMA, exposing XAG/USD to $64.00 and possibly $63.50 as the next support levels. Alternatively, a neutral consolidation may see XAG/USD range between $65.50–$66.00 as market participants assess the sustainability of the recent all-time high.
Market Outlook: Technical and Sentiment Alignment
The market sentiment for silver remains constructively bullish, supported by the overall uptrend and technical validation from the recent breakout above key support. While profit-taking has temporarily pulled prices below $66.00, the upward trajectory of moving averages, coupled with momentum indicators, reinforces the potential for dip-buying.
Short-term traders are advised to monitor the RSI and MACD closely. A hold above 50 on the RSI combined with a MACD rebound would strengthen the case for renewed upward momentum. Conversely, a decisive breach of the 100-hour SMA could signal a deeper corrective phase, offering entry points for strategic buyers.
Conclusion: XAG/USD Technical Summary
Silver’s retracement below $66.00 represents a normal profit-taking phase after hitting an all-time high. The bullish technical setup, including the rising 100-hour SMA, suggests that the commodity is poised for dip-buying opportunities on any corrective slides. Key technical indicators, such as the RSI and MACD, highlight short-term cooling in momentum but do not negate the overall uptrend.
In summary, the XAG/USD market remains constructively bullish, with critical support levels at $64.00 and the 100-hour SMA serving as potential entry points. Traders looking to capitalize on the white metal’s upward trend should watch for RSI stability above 50, MACD positive signals, and a sustained bounce off key support, signaling the continuation of the bullish momentum in the near term.