
Bitcoin (BTC) continues to dominate the cryptocurrency market, yet its near-term trajectory remains under intense scrutiny. After a remarkable rebound from February lows, BTC/USD now faces a critical test that could determine whether the bear market persists or finally ends.
Analysts are closely watching the 200-day exponential moving average (200-day EMA), which has historically acted as a pivotal resistance point for Bitcoin. Readers can find a complete discussion of this topic from Rubizio’s brokers in this article.
Bitcoin Faces Critical 200-Day EMA Resistance
As of Monday, Bitcoin’s price fell 2.25% to approximately $80,500, wiping out overnight gains after failing once again to breach the 200-day EMA. This resistance level, currently near $82,580, has capped Bitcoin’s recovery attempts since November 2025. Historically, rejections at this technical barrier have preceded substantial sell-offs, fueling fears of further declines.
Past instances show that each 200-day EMA rejection led to significant downturns: one triggered a 25% drop, while another sparked a 36% sell-off, averaging a 30% decline in each case. Analysts warn that if history repeats itself, Bitcoin could retreat toward $56,600, a figure that coincides with the cryptocurrency’s broader macro support range.
Institutional Activity Could Influence BTC’s Next Move
Alongside technical indicators, institutional investor behavior may play a decisive role in Bitcoin’s trajectory. Recent on-chain data shows rising whale accumulation at levels near $80,000, suggesting that large holders are preparing for a potential breakout above the 200-day EMA.
Conversely, short-term traders appear cautious, with futures open interest and options put-call ratios indicating a hedging bias, which could amplify volatility if the price tests the $82,500 resistance again.
Historical Perspective: Past Drawdowns from Key Technical Levels
Looking back, Bitcoin’s interactions with the 200-day EMA offer crucial insights for both traders and investors. In November 2025, a rejection at this level triggered a 25% BTC decline, underscoring the EMA’s role as resistance. Similarly, a previous 36% drawdown occurred after an earlier failed attempt to break above the EMA, reinforcing its significance as a key technical indicator in assessing market trends.
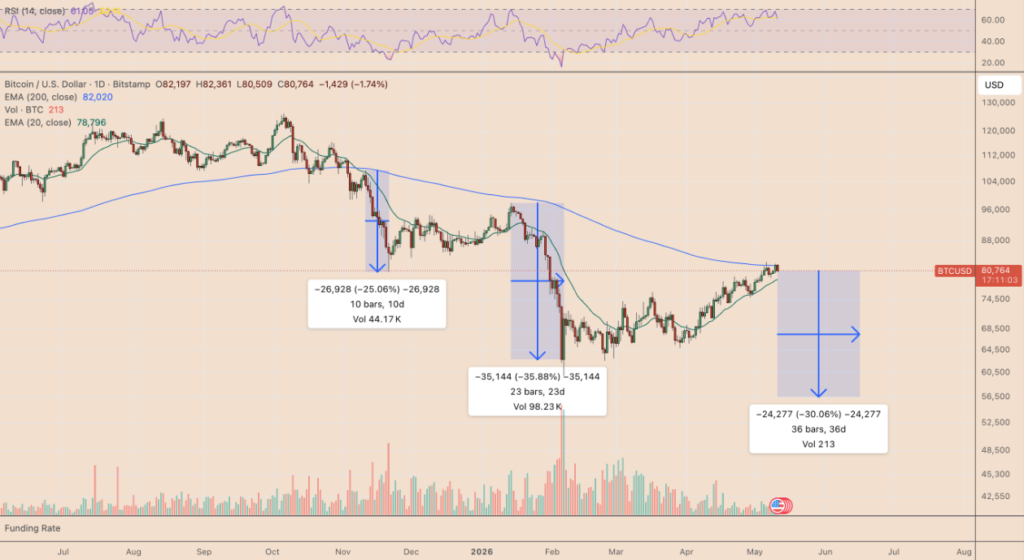
The average 30% drop from prior rejections offers a framework to anticipate possible declines. Applying this historical lens, a repetition of the pattern could push BTC toward the $56,600 level, which coincides with the cryptocurrency’s long-term support zones.
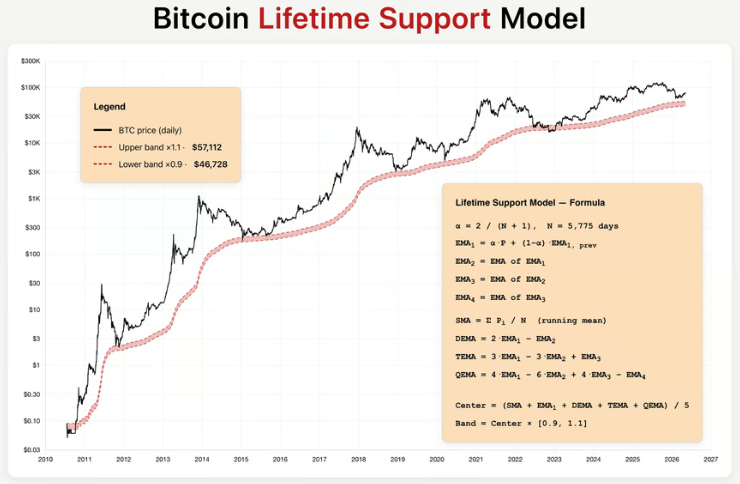
Bitcoin Lifetime Support Model Reinforces Mid-$50,000 Support
A Bitcoin Lifetime Support Model highlights potential downside protection by integrating simple moving averages (SMA) and exponential moving averages (EMAs) over various periods, forming a 10% support band around the average.
The model identifies several key levels for Bitcoin that traders and investors should watch closely. The upper long-term support is set at $57,110, acting as a critical floor that could stabilize price action. Meanwhile, the lower support sits at $46,760, representing a deeper level where buying interest may intensify if prices decline further. These support zones are essential for gauging potential trend reversals and managing risk in the market.
Historically, these lifetime support zones have acted as macro bear-market floors, suggesting that even if BTC experiences a pullback toward the mid-$50,000s, it remains near a significant long-term support area.
Unresolved Bear Flag Pattern Adds to Short-Term Bearish Risks
Beyond the 200-day EMA, Bitcoin faces another technical formation: an unresolved bear flag pattern. Such patterns often indicate a potential continuation of a downtrend, increasing the likelihood of BTC dipping below $60,000 in the near term. Traders should monitor the flag’s lower boundary, as a decisive break could confirm bearish momentum and set the stage for further declines.
2026 Rebound Reflects Historical Cycle Bottoms
Despite these near-term bearish signals, Bitcoin’s recent rebound contains historically bullish elements. After testing the 200-week simple moving average (200-week SMA) near $61,000, BTC surged over 38%, highlighting a recovery pattern reminiscent of past cycle bottoms.
The 2026 rebound mirrors these historical behaviors, suggesting that while short-term market risks remain, long-term bullish potential is intact. Investors may find confidence in the alignment between current price action and previous macro cycle recoveries.
Conclusion
Bitcoin’s current price action reflects a critical crossroads between bearish caution and bullish opportunity. While the 200-day EMA continues to act as a formidable barrier, breaking above it could signal a decisive shift in sentiment, potentially ending the bear market. Conversely, historical patterns, bear flag formations, and macro support models indicate that a mid-$50,000 pullback remains plausible.
For traders and investors, navigating this landscape requires careful attention to key technical levels, historical drawdowns, and macro support zones. The coming sessions will likely determine whether Bitcoin finally escapes its bearish cycle or faces another significant correction.