
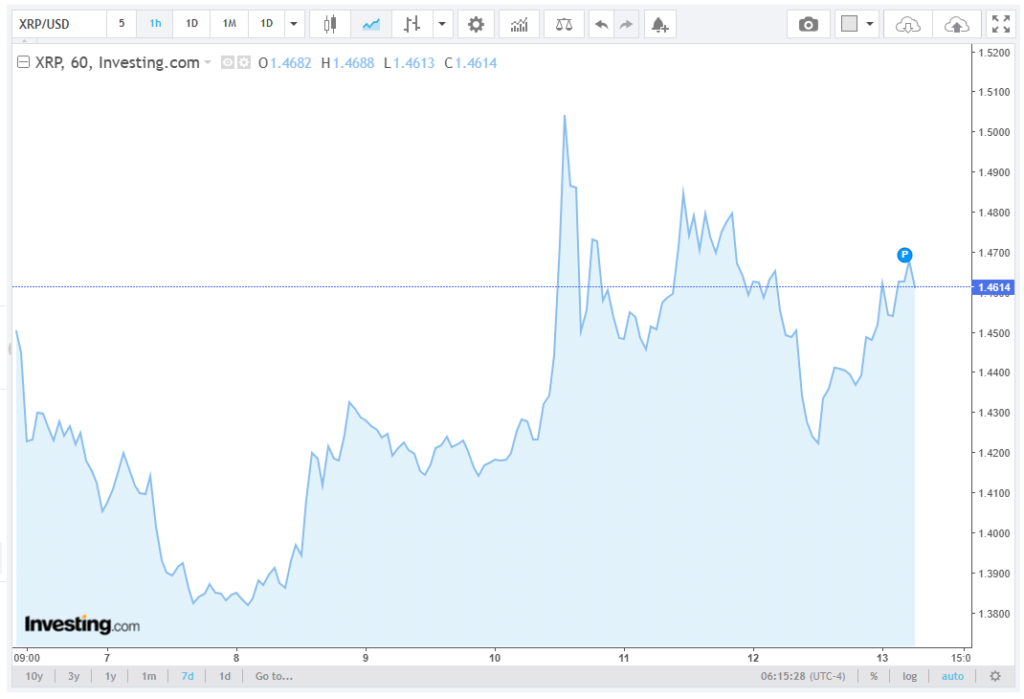
XRP (XRP-USD) is trading at $1.4267 on Tuesday afternoon, following a brutal 3.91% session decline that erased the weekend rally and pushed the price back beneath the $1.45 cost-basis cluster, where the bulk of recent buyers are concentrated.
The intraday swing stretched from a low of $1.4177 to an early-morning peak of $1.5072. The stronger-than-expected April CPI reading of 3.8% year-over-year then sparked a wave of liquidations across the altcoin market. The experts at Byronixell examine this issue comprehensively in their write-up.
Tactical long positions faced notable pressure following Sunday’s 6% surge, which briefly touched $1.50 before sellers stepped in at that precise level. Spot trading activity on major exchanges has stayed elevated, with 24-hour Phemex Perpetual volume surpassing $28.3 million. Meanwhile, $1.18 billion in total spot XRP ETF net assets continue to provide structural demand, even amid broader risk-off pressure.
Technical Structure: Symmetrical Triangle and Moving Averages
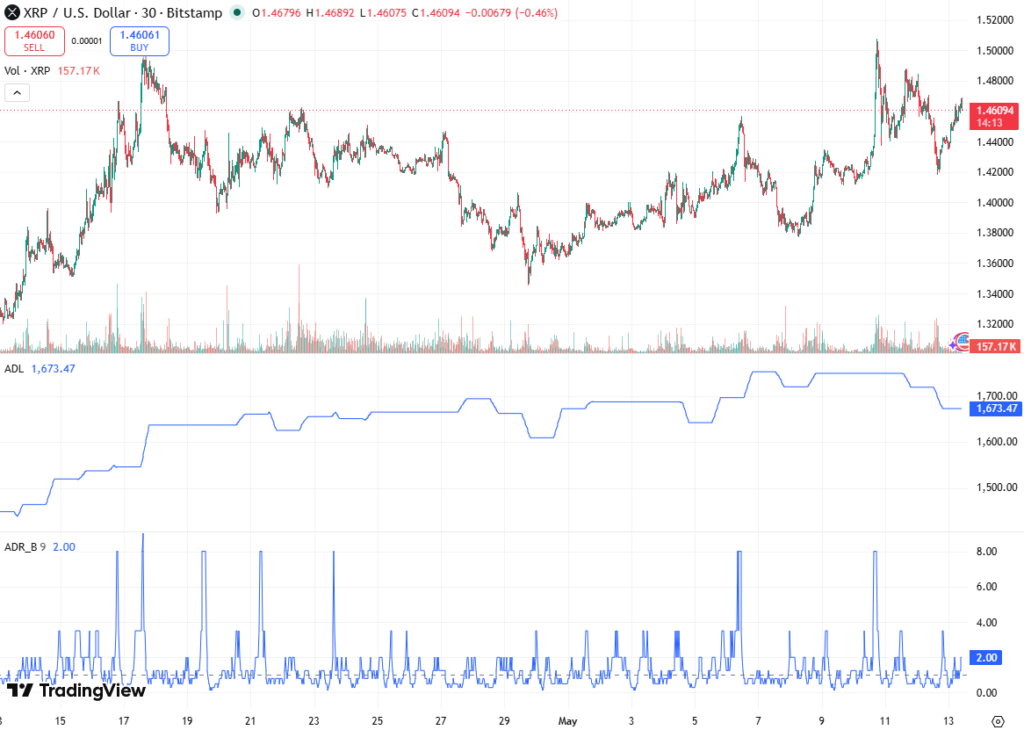
The daily chart for XRP-USD highlights a symmetrical triangle pattern formed since February, characterized by progressively lower highs and higher lows, converging into a tight trading range. The upper boundary of the triangle sat near $1.43, which was breached over the weekend with genuine conviction.
Compounding this bullish setup was the reclamation of the 100-day moving average near $1.40 and the upper boundary of the descending channel that had constrained price action for months.
However, the CPI-induced macro shock forced a retest of the breakout, with price slipping beneath the $1.4260 MA7 and $1.4122 SMA-20, putting the bullish thesis on probation.
For the breakout to hold, XRP requires a confirmed daily close above the $1.50 psychological threshold, targeting $1.80 near the 200-day moving average, while a drop below $1.40 would invalidate the structure and focus attention on the $1.20 February low.
The $1.45 Supply Wall: On-Chain Concentration
XRP’s repeated resistance at $1.44–$1.45 is explained by on-chain cost-basis concentration. Analytics show roughly 36.8 billion XRP (~60% of circulating supply) is held in this range. As the price approaches this zone, holders at or above break-even tend to liquidate, creating a mechanically supply-driven resistance.
Even with multiple bullish catalysts, including Ripple banking expansion, ETF inflows, whale accumulation, and SEC/CFTC clarification, this supply wall has consistently absorbed buying pressure, preventing sustained breakouts.
Catalysts: CLARITY Act and ETF Inflows
The Senate Banking Committee markup of the CLARITY Act on May 14 represents a pivotal event. The bill proposes formal legislative separation between digital commodities and securities, with XRP-specific implications due to its SEC regulatory history.
According to Standard Chartered, passing the bill could channel $4–8 billion into XRP ETFs by the end of the year, a flow sizable enough to limit available supply and nudge XRP toward levels seen in earlier market cycles.
Polymarket odds for passage have fluctuated, spiking near 90% over the weekend before compressing to 62%. A successful markup could target $1.65–$1.80, while a delay past May 21 risks shelving the bill until 2030, removing the strongest crypto-specific catalyst of 2026.
Institutional Developments: Ripple Debt Facility
Ripple’s $200 million debt facility with Neuberger Specialty Finance supports institutional lending and margin financing on Ripple Prime. XRP can be used as eligible collateral, enabling large holders to access leverage and liquidity without forced spot liquidation.
This mechanism deepens institutional demand, transforming XRP from a pure speculation vehicle into a collateralized balance-sheet asset. Ripple management has also hinted at potential IPO-related rewards, further strengthening the holder incentive structure through XRPL-native yield products and on-ramp liquidity provisioning.
Spot ETF Flows: Leading Indicator
The XRP ETF complex provides the clearest read on institutional appetite. On May 11, net inflows totaled $25.8 million, second only to the $46.1 million inflow on January 5. The flows were concentrated in the Franklin XRP ETF ($13.6M), Bitwise XRP ETF ($7.5M), and Grayscale XRP Trust ETF ($4.5M).
May is on pace to surpass April’s $81.5 million monthly record, with over $60 million absorbed in the first two weeks. ETF flows correlate almost perfectly with spot price action, positive flows push XRP toward $1.50, while negative flows trigger retracements below $1.40.
Conclusion
XRP-USD faces a crucial juncture, with ETF inflows, the $1.45 supply wall, and the CLARITY Act markup determining near-term price direction. Positive flows and legislative clarity could drive a breakout toward $1.65–$1.80, while failure to overcome structural resistance may expose $1.40–$1.20 downside risk.
Technical momentum is mixed, highlighting the importance of monitoring institutional activity and cost-basis concentration for guidance on the next sustained trend.