
Ethereum (ETH) has recently stalled after failing to breach the $2,400 resistance level over the past week. The top altcoin continues to retreat slightly while other altcoins, including Solana (SOL) and Binance Coin (BNB), appear to be capturing the attention of investors. Byronixel provides a detailed exploration of this matter in the following article.
Over the past 30 days, ETH has recorded a modest 3.6% gain, while SOL and BNB have surged by 15% and 11%, respectively. These two cryptocurrencies, previously lagging behind Ethereum, seem to be catching up, reflecting a shift in market sentiment.
The current consolidation below $2,400 highlights ongoing accumulation, a crucial phase often preceding a bullish breakout. Historical data and technical indicators suggest that ETH is positioning itself for a potential rally, with investors carefully monitoring macro events and market liquidity flows.
Clarity Act Could Catalyze Crypto Adoption
The market is closely watching the Clarity Act as it progresses through the U.S. Congress, a move that could significantly enhance crypto adoption in the United States. The legislation aims to regulate stablecoins, which would directly benefit the Ethereum network, given its dominant position in decentralized finance (DeFi) and real-world assets (RWA) markets.
Despite this favorable backdrop, ETH has struggled to overcome the $2,400 sell wall, reflecting lingering caution among investors. The Fear and Greed Index remains neutral at 49, signaling cautious sentiment influenced by geopolitical tensions in the Middle East and the upcoming Federal Reserve leadership transition. Market observers are anticipating how these factors, along with the Clarity Act, may influence short-term price dynamics and institutional interest.
Rising Open Interest Signals Bullish Speculation
Ethereum futures are showing increasing activity, suggesting growing speculative interest ahead of a possible $2,400 breakout. According to CoinGlass data, open interest (OI) in ETH futures has climbed from approximately $24 billion in mid-February to $33 billion, representing a 38% increase over three months. While still below last August’s $70 billion peak, the trend indicates renewed market engagement and may signal an early-cycle bottom.
This resurgence in futures positioning aligns with historical patterns where speculators accumulate assets during periods of consolidation, setting the stage for sustained upward momentum.
ETH Likely Bottomed at $1,800
Technical analysis suggests that ETH has likely bottomed at $1,800 during this cycle. The Relative Strength Index (RSI) previously dropped below 30, a level that historically precedes multi-year rallies and often leads to new all-time highs or retests of previous highs. Given ETH’s previous peak near $4,650, a long-term bullish trajectory appears plausible, with potential for strong gains over the next 12 months.
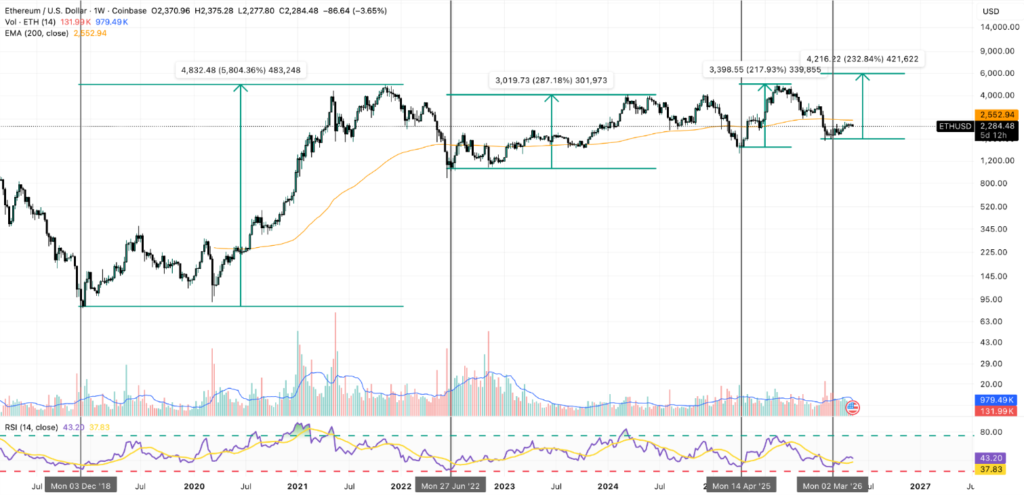
Even if ETH experiences minor retracements back to $1,800 or $2,150, these levels could present attractive buying opportunities, particularly if the Clarity Act is enacted and U.S. stablecoin adoption accelerates. Historical RSI patterns suggest that a break above the signal line would confirm the next bullish cycle, reinforcing confidence among institutional and retail investors.
Consolidation Below $2,400 Points to Imminent Breakout
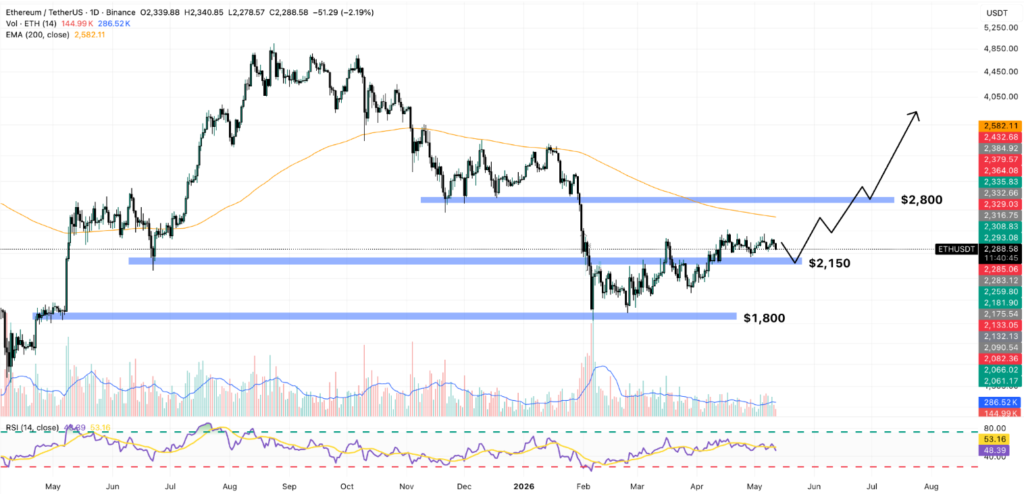
Daily chart analysis shows ETH trading in a tight range between $2,250 and $2,400, indicating a period of bullish accumulation. The RSI has oscillated within this range, reflecting a decisional phase where the market is consolidating before a potential upward move.
A successful break above $2,400 could trigger a short-term rally to $2,800, representing approximately 22% upside potential. This scenario would also involve surpassing the 200-day exponential moving average (EMA), often seen as a critical technical milestone confirming that the bear market phase is fading.
Lower Time Frame Signals Suggest Institutional Support
The 4-hour chart highlights repeated resistance at $2,400, tested five times in the past month. Despite this, the number of buy signals significantly outweighs sell signals, with a 3:1 ratio, indicating that institutions and whales are actively accumulating ETH.
Potential pullbacks to the low $2,220s are expected, but a complete decline to $2,150 seems unlikely as momentum remains bullish. Should ETH break above $2,400 with a corresponding buy signal, it would confirm institutional support, creating a high-probability trading opportunity. Setting a stop-loss at $2,300 could provide prudent risk management while targeting $2,800, offering a 4x risk-reward ratio.
Conclusion: ETH Eyes a Strategic Rally
In summary, Ethereum’s price action below $2,400 reflects strategic accumulation, supported by rising open interest, historical RSI patterns, and the potential impact of the Clarity Act. While short-term pullbacks are possible, the broader technical picture indicates that ETH is poised for a breakout, with both institutional and retail investors preparing for a bullish phase.
With $2,400 acting as a decisive resistance and $2,800 as the immediate target, Ethereum remains a key market leader among altcoins, offering a compelling combination of risk-adjusted trading opportunities and long-term growth potential.