
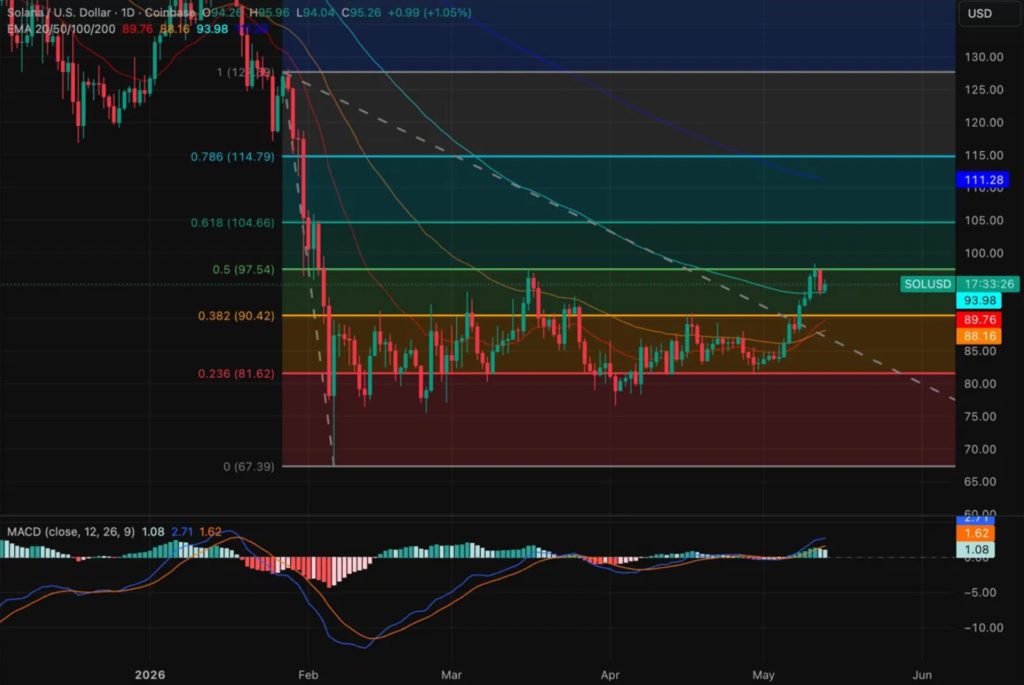
Solana (SOL) has entered a bullish phase, trading at $95.26 on May 13, following a decisive break above the 0.382 Fibonacci retracement level that had acted as a stubborn resistance barrier for three months.
This move comes amid growing optimism in the market, fueled by accelerating spot ETF inflows and strengthening momentum indicators. This article from Byronixell gives a full overview of the topic at hand.
Notably, the daily MACD has printed its first bullish cross since January, signaling renewed buying interest and the potential for a sustained upward trend. As technical patterns align with increasing institutional participation, SOL is now positioned for a potential test of higher Fibonacci levels, making it a critical period for both traders and investors to monitor price action and market sentiment closely.
SOL Daily Chart: First Fib Breakout Since the February Crash
From February through April, the SOL price was constrained between the 0.236 Fib at $81.62 and the 0.382 Fib at $90.42, failing to close above either level with conviction. This consolidation reflected a period of indecision following the February crash, as traders waited for more clarity on both macro supply dynamics and spot ETF activity.
The breakout above the 0.382 Fib in early May marked the first sustained move past this resistance in over three months. Currently, SOL is approaching the 0.5 Fib at $97.54, which represents the next significant resistance. Beyond that, the 0.618 Fib at $104.66 and the 0.786 Fib at $114.79 remain key upside targets. This sequence of Fibonacci retracement levels provides traders with a roadmap for potential price continuation.
MACD Confirms Bullish Momentum
Technical momentum indicators back the bullish move. The MACD line at 1.08 crossed above the signal line at 2.71, while the histogram expanded to 1.62, marking the first clean daily bullish MACD cross since January. This shift indicates that momentum is turning positive and that buyers are increasingly in control.
Additional technical support comes from exponential moving averages (EMAs). The 20 EMA at $89.76 and 50 EMA at $88.16 are now acting as dynamic support levels, providing a base for further upside. Immediate resistance lies at the 100 EMA at $93.98, which coincides with current price levels. For the bullish momentum to sustain, SOL needs a clean close above the 100 EMA, confirming that the breakout is not a false signal.
SOL Spot ETF Flows: Five Positive Days in Six Sessions
Institutional and retail interest in SOL has accelerated, particularly through spot ETFs. On May 12, SOL spot ETFs recorded $19.07M in daily inflows, following $26.57M the previous session. Cumulative inflows have now crossed $1.10B, with total net assets reaching $1.06B.
Among major ETFs, Bitwise’s BSOL led the inflows on May 12 with $15.98M, pushing its cumulative total to $899.18M. Fidelity’s FSOL added $3.09M, signaling consistent institutional accumulation. This surge in spot ETF inflows provides a tangible bullish catalyst, reflecting growing confidence in SOL as a long-term holding.
SOL Derivatives: Shorts Absorbing More Pain at Resistance
While spot markets show strength, derivatives activity reflects cautious positioning. Volume dropped 12.83% to $9.62B, while open interest fell 2.58% to $6.42B. Both metrics declining after a breakout week is typical consolidation, not distribution.
Meanwhile, options open interest rose 4.22% to $108.35M, suggesting traders prefer options hedging rather than spot leverage to position for potential upside. Retail traders on Binance show long positions at 1.5497, while top traders are slightly more bullish at 1.7398.
Liquidation data highlights market stress: over 24 hours, $8.89M in longs were liquidated compared to $1.63M in shorts. This shows that shorts are absorbing less pain, though neither extreme signals an imminent squeeze.
Spot Netflow Flips Positive Near Key Resistance
On May 13, SOL spot netflow came in at +$8.02M, indicating increased inflows onto exchanges near resistance. While a single positive netflow day does not reverse the longer-term macro supply trend, it is significant as price tests the 0.5 Fib at $97.54. Continued positive netflows would strengthen the bullish narrative and support further gains.
Conclusion: Bullish Bias Strengthens
SOL has broken a three-month Fib resistance, supported by bullish MACD momentum and robust spot ETF inflows. Immediate resistance at $97.54 and $104.66 will test whether the breakout is sustainable. EMAs at $88–$94 provide dynamic support, while derivatives data suggest measured positioning rather than aggressive leverage.
Traders should watch spot netflows, MACD expansion, and ETF accumulation, as these factors collectively shape the next potential leg higher. The technical setup and institutional interest suggest that Solana could continue its bullish trend, provided it maintains momentum above key Fibonacci and EMA levels.