
The US Dollar Index (DXY), a benchmark that measures the Greenback against a basket of major global currencies, is currently under intense selling pressure. Following news of a ceasefire between the United States and Iran, the index has plunged to its lowest level in nearly a month, highlighting a shift toward risk-on sentiment in global markets.
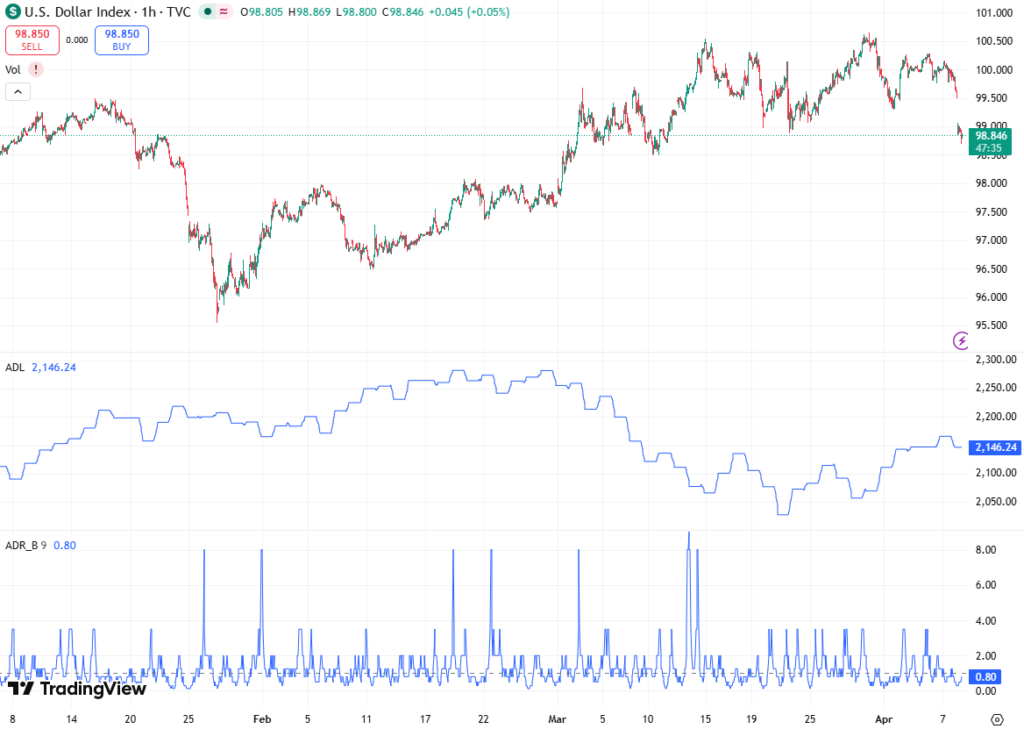
As of the Asian session, the DXY trades around the 98.80 region, down roughly 0.80% on the day, suggesting further potential weakness in the near term. The team of brokers at Fondesia explores this topic in detail in the following article.
Ceasefire News Spurs Risk-On Rally
The US President announced a two-week suspension of planned military action against Iran, triggering a global risk-on rally. The announcement undermines the traditional role of the USD as a safe-haven currency, prompting traders to reduce positions in the DXY.
The news also led to the reopening of the Strait of Hormuz, resulting in a sharp intraday decline in crude oil prices, down over 10%. Lower oil prices ease inflationary concerns, which in turn reduces **speculation about future Federal Reserve (Fed) rate hikes, creating additional downward pressure on the Greenback.
Markets are interpreting the ceasefire as a signal of reduced geopolitical tension, encouraging investment into riskier assets such as equities and commodities, while simultaneously weakening demand for the USD. This dynamic is central to understanding why the DXY is struggling to hold above the 99.00 psychological level.
Technical Analysis: Fibonacci Levels and Moving Averages
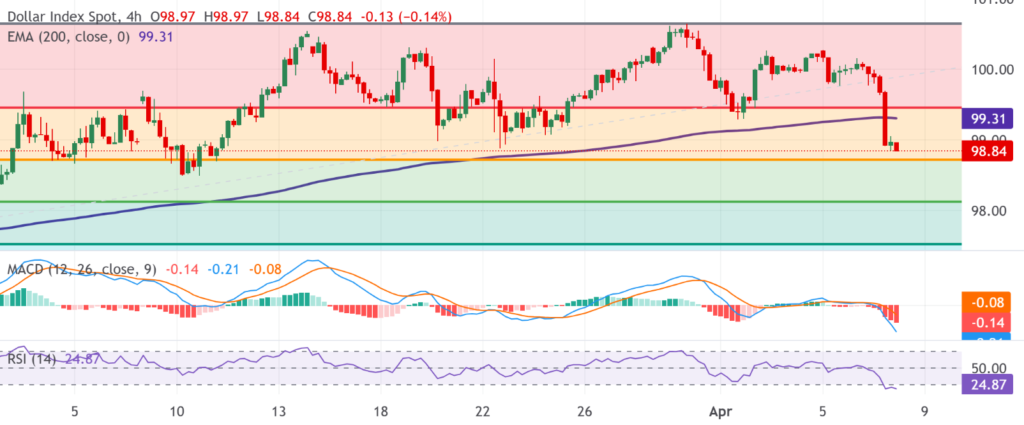
From a technical standpoint, the DXY’s current weakness is evident in its relationship with key Fibonacci retracement levels. The index recently broke below the 23.6% retracement of the January-March rally, signaling the start of potential extended downside movement. A further decline below the 200-period Exponential Moving Average (EMA) on the 4-hour chart could act as a trigger for bearish momentum, providing USD sellers with an entry point.
The Moving Average Convergence Divergence (MACD) confirms this bearish bias. The MACD line has slipped beneath its signal line just under the zero mark, while negative histogram bars continue to expand, indicating growing downside momentum. This technical setup suggests that short-term weakness may persist, particularly if support levels are breached.
Oversold Conditions and Support Levels
The Relative Strength Index (RSI), a momentum oscillator, is currently hovering in the mid-20s, which technically places the DXY in oversold territory. While this might suggest the potential for a short-term corrective bounce, the overall trend remains downward, reflecting persistent selling pressure.
Immediate support levels are currently found around the 38.2% Fibonacci retracement at 98.72. If this level fails to hold, the next area of interest lies at the 50.0% retracement near 98.13, which could serve as a critical threshold for USD bears. Traders should watch these levels closely, as breaks below them could accelerate the decline, opening the door toward further downside toward the mid-98s.
Resistance Levels and Recovery Scenarios
On the upside, resistance is anchored near the 23.6% retracement at 99.46, reinforced by the 200-period EMA near 99.30. A sustained move above 99.46 would relieve immediate bearish pressure and could pave the way for a test of the 100.00 handle, which is a key psychological barrier. Conversely, failure to reclaim the EMA would likely keep sellers in control, maintaining the negative trajectory toward deeper Fibonacci supports.
Technical traders should also monitor the interplay between momentum indicators and support/resistance zones. If the RSI remains oversold while MACD momentum expands, the DXY may experience accelerated downside, even amid sporadic corrective bounces.
Macro Drivers: Inflation and Fed Rate Outlook
The broader macro backdrop continues to influence the DXY’s movements. The easing of inflation concerns, driven in part by lower crude oil prices, has tempered market expectations of aggressive Fed rate hikes. This shift is particularly important because the DXY often benefits from higher US interest rates, which attract capital inflows.
Additionally, geopolitical stability stemming from the US-Iran ceasefire reinforces risk-on behavior, encouraging traders to diversify away from USD assets. These factors combine to create an environment in which the DXY may struggle to recover above critical resistance levels in the short term.
Conclusion: Bearish Outlook Dominates
In conclusion, the US Dollar Index (DXY) is experiencing intense downward pressure amid geopolitical easing, lower inflation expectations, and technical weakness. With the index trading below 99.00 and approaching key support levels at 98.72 and 98.13, the short-term outlook remains bearish.
Traders should monitor the 200-period EMA, Fibonacci retracement zones, MACD, and RSI to gauge potential reversals or continuation patterns. On the upside, a recovery above 99.46 could shift sentiment slightly, but current conditions favor USD sellers as risk-on sentiment dominates global markets.